r5.12xlarge by Amazon Web Services
Geekbench is a cross-platform processor benchmark with a scoring system that determines single-core and multi-core performance using loads simulating real-world scenarios. Geekbench 5 score is calculated with a reference score of 2500 representing the performance of the Intel Core i5-2520M @ 2.50 GHz. The software benchmark is available for Mac OS, Windows, Linux, Android and iOS platforms.
Specifications:
CPU
48
RAM
384.0 GB
Net
10000 Mbps
{
"configuration": {
"chart": {
"type": "scatter",
"polar": false,
"zoomType": "",
"options3d": {},
"height": null,
"width": null,
"margin": null,
"inverted": false,
"zooming": {}
},
"credits": {
"enabled": false
},
"title": {
"text": ""
},
"colorAxis": null,
"subtitle": {
"text": ""
},
"xAxis": {
"title": {
"text": [
"Single Score"
],
"useHTML": false,
"style": {
"color": "#666666"
}
},
"categories": null,
"lineWidth": 1,
"tickInterval": null,
"tickWidth": 1,
"tickLength": 10,
"tickPixelInterval": 100,
"plotLines": null,
"labels": {
"enabled": true,
"format": null,
"formatter": "",
"style": {
"color": "#666666",
"cursor": "default",
"fontSize": "11px"
},
"useHTML": false,
"step": 0
},
"plotBands": null,
"visible": true,
"floor": null,
"ceiling": null,
"type": "linear",
"min": 0,
"gridLineWidth": 1,
"gridLineColor": "#e6e6e6",
"minorTickInterval": null,
"minorTickWidth": 0,
"minTickInterval": null,
"startOnTick": true,
"endOnTick": true,
"tickmarkPlacement": 100,
"units": 100,
"minRange": 100
},
"yAxis": {
"title": {
"text": [
"Multi Score"
],
"useHTML": false,
"style": {
"color": "#666666"
}
},
"categories": null,
"plotLines": null,
"plotBands": null,
"lineWidth": null,
"tickInterval": null,
"tickLength": 10,
"floor": null,
"ceiling": null,
"gridLineInterpolation": null,
"gridLineWidth": 1,
"gridLineColor": "#e6e6e6",
"min": 0,
"max": null,
"minorTickInterval": null,
"minorTickWidth": 0,
"minTickInterval": null,
"startOnTick": true,
"endOnTick": true,
"minRange": null,
"type": "linear",
"tickmarkPlacement": null,
"labels": {
"enabled": true,
"formatter": null,
"style": {
"color": "#666666",
"cursor": "default",
"fontSize": "11px"
},
"useHTML": false
}
},
"zAxis": {
"title": {
"text": "Multi Score"
}
},
"plotOptions": {
"series": {
"dataLabels": {
"enabled": false,
"format": null,
"distance": 30,
"align": "center",
"inside": null,
"allowOverlap": false,
"style": {
"fontSize": "11px"
}
},
"showInLegend": null,
"turboThreshold": 0,
"stacking": "",
"groupPadding": 0.2,
"centerInCategory": false,
"findNearestPointBy": "x"
}
},
"navigator": {
"enabled": false
},
"scrollbar": {
"enabled": false
},
"rangeSelector": {
"enabled": false,
"inputEnabled": false
},
"legend": {
"enabled": null,
"maxHeight": null,
"align": "center",
"verticalAlign": "bottom",
"layout": "horizontal",
"width": null,
"margin": 12,
"reversed": false
},
"series": [
{
"name": "r5.12xlarge by Amazon Web Services",
"color": "#f7981d",
"data": [
{
"x": 967.1139805775579,
"y": 20026.128019960204
},
{
"x": 967.7012144800296,
"y": 19993.018064369513
},
{
"x": 967.1055766292188,
"y": 19901.767252422353
},
{
"x": 966.9513708219451,
"y": 19932.28600847028
},
{
"x": 968.8139685445846,
"y": 19864.2067164589
},
{
"x": 962.8845704518878,
"y": 19995.72552551581
},
{
"x": 968.0556334185427,
"y": 20001.06222541463
},
{
"x": 966.0371429253025,
"y": 20015.090673220002
},
{
"x": 967.5597196454426,
"y": 19925.880079453862
},
{
"x": 963.462578147233,
"y": 19979.134549367005
},
{
"x": 968.124592475544,
"y": 20021.957302058152
},
{
"x": 965.3031740573571,
"y": 19949.913378871403
},
{
"x": 966.1498583883731,
"y": 19951.583232131976
},
{
"x": 965.0505318947849,
"y": 19887.42818936907
},
{
"x": 965.7258889791045,
"y": 20045.958730772858
},
{
"x": 965.2516039086122,
"y": 20015.021710953395
},
{
"x": 966.3951996996836,
"y": 20061.00984437277
},
{
"x": 963.8620577111116,
"y": 19908.394349939652
},
{
"x": 969.2655451154872,
"y": 19884.88762346379
},
{
"x": 966.4375778398373,
"y": 19929.494575868674
}
]
}
],
"drilldown": {},
"tooltip": {
"enabled": true,
"useHTML": false,
"format": null,
"headerFormat": "",
"pointFormat": "<span style=\"color:{series.color}\">Single</span>: <b>{point.x:.0f}</b><br><span style=\"color:{series.color}\">Multi</span>: <b>{point.y:.0f}</b>",
"footerFormat": "",
"shared": false,
"outside": false,
"valueDecimals": null,
"split": false
},
"annotations": null
},
"hc_type": "chart",
"id": "105145477142268217469466198540618936170"
}
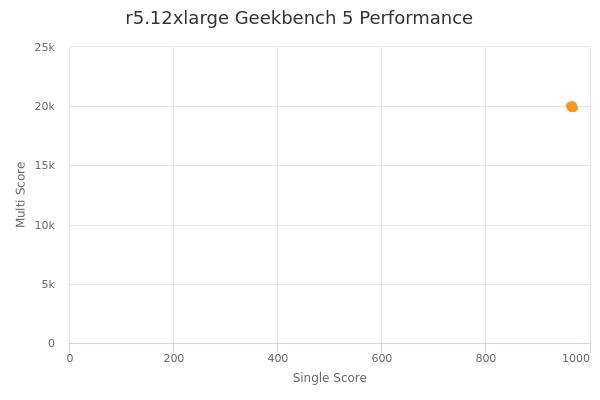
| Single | Multi | |
|---|---|---|
| Max | 969 | 20061 |
| Average | 966 | 19964 |
| Deviation | 1.68 | 57.03 |
| Min | 963 | 19864 |
Sign up as Freemium to get more insight.
- In same series
- r5.large
- r5.xlarge
- r5.2xlarge
- r5.4xlarge
- r5.8xlarge
- r5.12xlarge
- r5.16xlarge
- r5.24xlarge
- r5.metal