m7i.large by Amazon Web Services
Geekbench is a cross-platform processor benchmark with a scoring system that determines single-core and multi-core performance using loads simulating real-world scenarios. Geekbench 5 score is calculated with a reference score of 2500 representing the performance of the Intel Core i5-2520M @ 2.50 GHz. The software benchmark is available for Mac OS, Windows, Linux, Android and iOS platforms.
Specifications:
CPU
2
RAM
8.0 GB
Net
12000 Mbps
{
"configuration": {
"chart": {
"type": "scatter",
"polar": false,
"zoomType": "",
"options3d": {},
"height": null,
"width": null,
"margin": null,
"inverted": false,
"zooming": {}
},
"credits": {
"enabled": false
},
"title": {
"text": ""
},
"colorAxis": null,
"subtitle": {
"text": ""
},
"xAxis": {
"title": {
"text": [
"Single Score"
],
"useHTML": false,
"style": {
"color": "#666666"
}
},
"categories": null,
"lineWidth": 1,
"tickInterval": null,
"tickWidth": 1,
"tickLength": 10,
"tickPixelInterval": 100,
"plotLines": null,
"labels": {
"enabled": true,
"format": null,
"formatter": "",
"style": {
"color": "#666666",
"cursor": "default",
"fontSize": "11px"
},
"useHTML": false,
"step": 0
},
"plotBands": null,
"visible": true,
"floor": null,
"ceiling": null,
"type": "linear",
"min": 0,
"gridLineWidth": 1,
"gridLineColor": "#e6e6e6",
"minorTickInterval": null,
"minorTickWidth": 0,
"minTickInterval": null,
"startOnTick": true,
"endOnTick": true,
"tickmarkPlacement": 100,
"units": 100,
"minRange": 100
},
"yAxis": {
"title": {
"text": [
"Multi Score"
],
"useHTML": false,
"style": {
"color": "#666666"
}
},
"categories": null,
"plotLines": null,
"plotBands": null,
"lineWidth": null,
"tickInterval": null,
"tickLength": 10,
"floor": null,
"ceiling": null,
"gridLineInterpolation": null,
"gridLineWidth": 1,
"gridLineColor": "#e6e6e6",
"min": 0,
"max": null,
"minorTickInterval": null,
"minorTickWidth": 0,
"minTickInterval": null,
"startOnTick": true,
"endOnTick": true,
"minRange": null,
"type": "linear",
"tickmarkPlacement": null,
"labels": {
"enabled": true,
"formatter": null,
"style": {
"color": "#666666",
"cursor": "default",
"fontSize": "11px"
},
"useHTML": false
}
},
"zAxis": {
"title": {
"text": "Multi Score"
}
},
"plotOptions": {
"series": {
"dataLabels": {
"enabled": false,
"format": null,
"distance": 30,
"align": "center",
"inside": null,
"allowOverlap": false,
"style": {
"fontSize": "11px"
}
},
"showInLegend": null,
"turboThreshold": 0,
"stacking": "",
"groupPadding": 0.2,
"centerInCategory": false,
"findNearestPointBy": "x"
}
},
"navigator": {
"enabled": false
},
"scrollbar": {
"enabled": false
},
"rangeSelector": {
"enabled": false,
"inputEnabled": false
},
"legend": {
"enabled": null,
"maxHeight": null,
"align": "center",
"verticalAlign": "bottom",
"layout": "horizontal",
"width": null,
"margin": 12,
"reversed": false
},
"series": [
{
"name": "m7i.large by Amazon Web Services",
"color": "#f7981d",
"data": [
{
"x": 1507.8395643075614,
"y": 1855.194729696809
},
{
"x": 1514.3976288788785,
"y": 1853.6293409000339
},
{
"x": 1512.456100605526,
"y": 1857.3549948701661
},
{
"x": 1511.5172396993812,
"y": 1850.539748673729
},
{
"x": 1515.6242480609558,
"y": 1859.3614851759044
},
{
"x": 1513.51424397041,
"y": 1838.210872784246
},
{
"x": 1514.4522449459769,
"y": 1856.231482084971
},
{
"x": 1512.0037240993133,
"y": 1856.5974108778887
},
{
"x": 1512.7320816880583,
"y": 1857.5881299658265
},
{
"x": 1512.7565159187789,
"y": 1854.4077874103127
},
{
"x": 1512.8898233155005,
"y": 1852.7957131048463
},
{
"x": 1512.359873397784,
"y": 1850.2428058365967
},
{
"x": 1511.9630729952785,
"y": 1856.2082591086792
},
{
"x": 1512.3674268934055,
"y": 1852.1047583546774
},
{
"x": 1510.387995296668,
"y": 1854.7553143573382
},
{
"x": 1513.1189550023696,
"y": 1847.02720461346
},
{
"x": 1511.1104724192876,
"y": 1862.3907759538165
},
{
"x": 1508.334556159636,
"y": 1852.3771275317215
},
{
"x": 1510.528990873503,
"y": 1859.796048263719
},
{
"x": 1507.7998780407192,
"y": 1851.432968897891
},
{
"x": 1472.8763218957388,
"y": 1791.2640560734635
},
{
"x": 1467.0091426964339,
"y": 1785.6123639102038
},
{
"x": 1446.4356695763772,
"y": 1792.8378201431838
},
{
"x": 1447.2592275644133,
"y": 1788.3918349299147
},
{
"x": 1462.1170112314362,
"y": 1779.6743857992028
},
{
"x": 1466.8778265405756,
"y": 1778.459538157361
}
]
}
],
"drilldown": {},
"tooltip": {
"enabled": true,
"useHTML": false,
"format": null,
"headerFormat": "",
"pointFormat": "<span style=\"color:{series.color}\">Single</span>: <b>{point.x:.0f}</b><br><span style=\"color:{series.color}\">Multi</span>: <b>{point.y:.0f}</b>",
"footerFormat": "",
"shared": false,
"outside": false,
"valueDecimals": null,
"split": false
},
"annotations": null
},
"hc_type": "chart",
"id": "288867395203720923781355557933534643711"
}
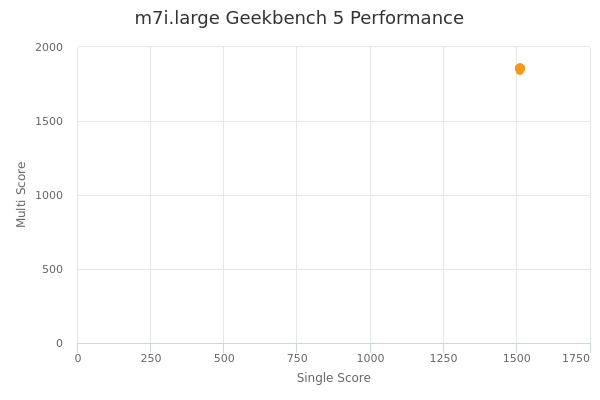
| Single | Multi | |
|---|---|---|
| Max | 1516 | 1862 |
| Average | 1500 | 1838 |
| Deviation | 22.30 | 29.06 |
| Min | 1446 | 1778 |
Sign up as Freemium to get more insight.