m7i.8xlarge by Amazon Web Services
Geekbench is a cross-platform processor benchmark with a scoring system that determines single-core and multi-core performance using loads simulating real-world scenarios. Geekbench 5 score is calculated with a reference score of 2500 representing the performance of the Intel Core i5-2520M @ 2.50 GHz. The software benchmark is available for Mac OS, Windows, Linux, Android and iOS platforms.
Specifications:
CPU
32
RAM
128.0 GB
Net
12000 Mbps
{
"configuration": {
"chart": {
"type": "scatter",
"polar": false,
"zoomType": "",
"options3d": {},
"height": null,
"width": null,
"margin": null,
"inverted": false,
"zooming": {}
},
"credits": {
"enabled": false
},
"title": {
"text": ""
},
"colorAxis": null,
"subtitle": {
"text": ""
},
"xAxis": {
"title": {
"text": [
"Single Score"
],
"useHTML": false,
"style": {
"color": "#666666"
}
},
"categories": null,
"lineWidth": 1,
"tickInterval": null,
"tickWidth": 1,
"tickLength": 10,
"tickPixelInterval": 100,
"plotLines": null,
"labels": {
"enabled": true,
"format": null,
"formatter": "",
"style": {
"color": "#666666",
"cursor": "default",
"fontSize": "11px"
},
"useHTML": false,
"step": 0
},
"plotBands": null,
"visible": true,
"floor": null,
"ceiling": null,
"type": "linear",
"min": 0,
"gridLineWidth": 1,
"gridLineColor": "#e6e6e6",
"minorTickInterval": null,
"minorTickWidth": 0,
"minTickInterval": null,
"startOnTick": true,
"endOnTick": true,
"tickmarkPlacement": 100,
"units": 100,
"minRange": 100
},
"yAxis": {
"title": {
"text": [
"Multi Score"
],
"useHTML": false,
"style": {
"color": "#666666"
}
},
"categories": null,
"plotLines": null,
"plotBands": null,
"lineWidth": null,
"tickInterval": null,
"tickLength": 10,
"floor": null,
"ceiling": null,
"gridLineInterpolation": null,
"gridLineWidth": 1,
"gridLineColor": "#e6e6e6",
"min": 0,
"max": null,
"minorTickInterval": null,
"minorTickWidth": 0,
"minTickInterval": null,
"startOnTick": true,
"endOnTick": true,
"minRange": null,
"type": "linear",
"tickmarkPlacement": null,
"labels": {
"enabled": true,
"formatter": null,
"style": {
"color": "#666666",
"cursor": "default",
"fontSize": "11px"
},
"useHTML": false
}
},
"zAxis": {
"title": {
"text": "Multi Score"
}
},
"plotOptions": {
"series": {
"dataLabels": {
"enabled": false,
"format": null,
"distance": 30,
"align": "center",
"inside": null,
"allowOverlap": false,
"style": {
"fontSize": "11px"
}
},
"showInLegend": null,
"turboThreshold": 0,
"stacking": "",
"groupPadding": 0.2,
"centerInCategory": false,
"findNearestPointBy": "x"
}
},
"navigator": {
"enabled": false
},
"scrollbar": {
"enabled": false
},
"rangeSelector": {
"enabled": false,
"inputEnabled": false
},
"legend": {
"enabled": null,
"maxHeight": null,
"align": "center",
"verticalAlign": "bottom",
"layout": "horizontal",
"width": null,
"margin": 12,
"reversed": false
},
"series": [
{
"name": "m7i.8xlarge by Amazon Web Services",
"color": "#f7981d",
"data": [
{
"x": 1515.1406758148241,
"y": 24657.378329697272
},
{
"x": 1462.766282840945,
"y": 23511.45216708923
},
{
"x": 1514.8224070781441,
"y": 24723.72897130421
},
{
"x": 1450.1431848374941,
"y": 23485.121225304654
},
{
"x": 1518.6343183760375,
"y": 24782.97252375829
},
{
"x": 1458.4288492395508,
"y": 23424.229156143698
},
{
"x": 1503.2505118975287,
"y": 24412.106293616736
},
{
"x": 1438.0505341384055,
"y": 23348.52238638447
},
{
"x": 1515.9490099110449,
"y": 24661.695610452774
},
{
"x": 1452.4021900309492,
"y": 23512.11078795807
},
{
"x": 1502.9275460821245,
"y": 24442.309044151625
},
{
"x": 1457.2108796375846,
"y": 23475.59898564044
},
{
"x": 1501.660370023115,
"y": 24822.434434842795
},
{
"x": 1459.4846108803708,
"y": 23961.89491173222
},
{
"x": 1501.8658736129544,
"y": 24851.063185634925
},
{
"x": 1468.887786103229,
"y": 23921.62276482803
},
{
"x": 1516.3452279073974,
"y": 24832.815749911842
},
{
"x": 1462.5561531520043,
"y": 23932.98584815745
},
{
"x": 1495.2146587466839,
"y": 24658.384608992663
},
{
"x": 1461.745893625997,
"y": 23880.227137224356
},
{
"x": 1445.9967369437838,
"y": 21676.845732441845
},
{
"x": 1443.1137340605837,
"y": 21759.42039942396
},
{
"x": 1453.1392713653033,
"y": 22256.81752532775
},
{
"x": 1447.5541955370331,
"y": 22357.628236761047
},
{
"x": 1461.4513616453721,
"y": 22743.147782659995
},
{
"x": 1464.3390128584315,
"y": 22798.940636204807
}
]
}
],
"drilldown": {},
"tooltip": {
"enabled": true,
"useHTML": false,
"format": null,
"headerFormat": "",
"pointFormat": "<span style=\"color:{series.color}\">Single</span>: <b>{point.x:.0f}</b><br><span style=\"color:{series.color}\">Multi</span>: <b>{point.y:.0f}</b>",
"footerFormat": "",
"shared": false,
"outside": false,
"valueDecimals": null,
"split": false
},
"annotations": null
},
"hc_type": "chart",
"id": "281818047980211089366328775271082542247"
}
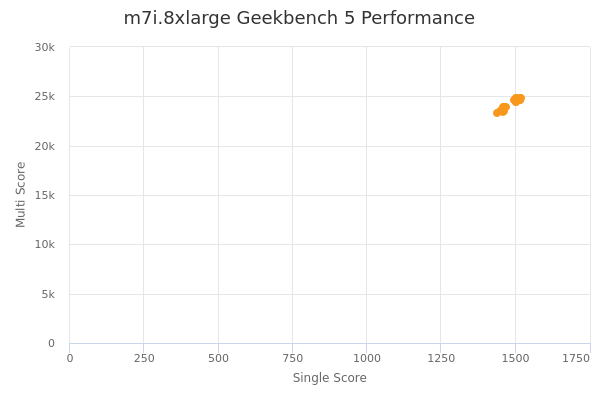
| Single | Multi | |
|---|---|---|
| Max | 1519 | 24851 |
| Average | 1476 | 23727 |
| Deviation | 27.11 | 959.39 |
| Min | 1438 | 21677 |
Sign up as Freemium to get more insight.