m6in.2xlarge by Amazon Web Services
Geekbench is a cross-platform processor benchmark with a scoring system that determines single-core and multi-core performance using loads simulating real-world scenarios. Geekbench 5 score is calculated with a reference score of 2500 representing the performance of the Intel Core i5-2520M @ 2.50 GHz. The software benchmark is available for Mac OS, Windows, Linux, Android and iOS platforms.
Specifications:
CPU
8
RAM
32.0 GB
Net
40000 Mbps
{
"configuration": {
"chart": {
"type": "scatter",
"polar": false,
"zoomType": "",
"options3d": {},
"height": null,
"width": null,
"margin": null,
"inverted": false,
"zooming": {}
},
"credits": {
"enabled": false
},
"title": {
"text": ""
},
"colorAxis": null,
"subtitle": {
"text": ""
},
"xAxis": {
"title": {
"text": [
"Single Score"
],
"useHTML": false,
"style": {
"color": "#666666"
}
},
"categories": null,
"lineWidth": 1,
"tickInterval": null,
"tickWidth": 1,
"tickLength": 10,
"tickPixelInterval": 100,
"plotLines": null,
"labels": {
"enabled": true,
"format": null,
"formatter": "",
"style": {
"color": "#666666",
"cursor": "default",
"fontSize": "11px"
},
"useHTML": false,
"step": 0
},
"plotBands": null,
"visible": true,
"floor": null,
"ceiling": null,
"type": "linear",
"min": 0,
"gridLineWidth": 1,
"gridLineColor": "#e6e6e6",
"minorTickInterval": null,
"minorTickWidth": 0,
"minTickInterval": null,
"startOnTick": true,
"endOnTick": true,
"tickmarkPlacement": 100,
"units": 100,
"minRange": 100
},
"yAxis": {
"title": {
"text": [
"Multi Score"
],
"useHTML": false,
"style": {
"color": "#666666"
}
},
"categories": null,
"plotLines": null,
"plotBands": null,
"lineWidth": null,
"tickInterval": null,
"tickLength": 10,
"floor": null,
"ceiling": null,
"gridLineInterpolation": null,
"gridLineWidth": 1,
"gridLineColor": "#e6e6e6",
"min": 0,
"max": null,
"minorTickInterval": null,
"minorTickWidth": 0,
"minTickInterval": null,
"startOnTick": true,
"endOnTick": true,
"minRange": null,
"type": "linear",
"tickmarkPlacement": null,
"labels": {
"enabled": true,
"formatter": null,
"style": {
"color": "#666666",
"cursor": "default",
"fontSize": "11px"
},
"useHTML": false
}
},
"zAxis": {
"title": {
"text": "Multi Score"
}
},
"plotOptions": {
"series": {
"dataLabels": {
"enabled": false,
"format": null,
"distance": 30,
"align": "center",
"inside": null,
"allowOverlap": false,
"style": {
"fontSize": "11px"
}
},
"showInLegend": null,
"turboThreshold": 0,
"stacking": "",
"groupPadding": 0.2,
"centerInCategory": false,
"findNearestPointBy": "x"
}
},
"navigator": {
"enabled": false
},
"scrollbar": {
"enabled": false
},
"rangeSelector": {
"enabled": false,
"inputEnabled": false
},
"legend": {
"enabled": null,
"maxHeight": null,
"align": "center",
"verticalAlign": "bottom",
"layout": "horizontal",
"width": null,
"margin": 12,
"reversed": false
},
"series": [
{
"name": "m6in.2xlarge by Amazon Web Services",
"color": "#f7981d",
"data": [
{
"x": 1211.8242046834705,
"y": 5326.050678307762
},
{
"x": 1174.8984825238424,
"y": 5225.872722140256
},
{
"x": 1211.7625706230626,
"y": 5306.032901317441
},
{
"x": 1170.2563644975385,
"y": 5208.3421861463
},
{
"x": 1211.9126094264648,
"y": 5327.887021632831
},
{
"x": 1176.7009624099082,
"y": 5195.777120337025
},
{
"x": 1195.6929040515327,
"y": 5310.394444241494
},
{
"x": 1183.1162627756144,
"y": 5263.767707022125
},
{
"x": 1206.292628922618,
"y": 5333.0926260191745
},
{
"x": 1174.982975104872,
"y": 5224.485024982806
},
{
"x": 1193.334705960059,
"y": 5294.62466884796
},
{
"x": 1175.4230963229127,
"y": 5283.326484348549
},
{
"x": 1209.9095974292604,
"y": 5325.193578584564
},
{
"x": 1178.8289890693186,
"y": 5213.744427108752
},
{
"x": 1186.8762688008364,
"y": 5297.530661363785
},
{
"x": 1191.501953398085,
"y": 5259.573889967682
},
{
"x": 1214.722910082452,
"y": 5317.299521714707
},
{
"x": 1208.252994439983,
"y": 5305.592334615189
},
{
"x": 1179.1783861129766,
"y": 5233.3032061675485
},
{
"x": 1191.176943654365,
"y": 5264.0702790869
},
{
"x": 1213.1263958102063,
"y": 5327.374779255738
},
{
"x": 1203.6071936227124,
"y": 5299.255457660034
},
{
"x": 1173.6555509340785,
"y": 5215.847647969906
},
{
"x": 1194.6728652334382,
"y": 5254.288559932282
},
{
"x": 1213.6094517575614,
"y": 5319.678040843185
},
{
"x": 1199.961991758057,
"y": 5312.190901480404
},
{
"x": 1199.1087101831486,
"y": 5258.42162803415
},
{
"x": 1171.5822598290865,
"y": 5225.547875579618
},
{
"x": 1214.5199325967787,
"y": 5330.415760062708
},
{
"x": 1192.8503996646673,
"y": 5302.6818674503165
},
{
"x": 1171.0727450955603,
"y": 5266.072417194955
},
{
"x": 1174.3766976410457,
"y": 5206.5498969218725
},
{
"x": 1214.4546350982878,
"y": 5315.490989193857
},
{
"x": 1194.9555036033903,
"y": 5302.949566367727
},
{
"x": 1188.1538275040211,
"y": 5252.8546755073285
},
{
"x": 1175.2760487455953,
"y": 5215.820237318564
},
{
"x": 1191.7953237057804,
"y": 5292.0974029530535
},
{
"x": 1170.4630731080276,
"y": 5263.772439155713
},
{
"x": 1197.432953015791,
"y": 5316.496339985168
},
{
"x": 1188.80385899466,
"y": 5236.311650895995
},
{
"x": 1147.6306373807265,
"y": 5071.438526899091
},
{
"x": 1114.023944008818,
"y": 4809.793658959435
},
{
"x": 1150.5205778130005,
"y": 5103.795839825225
},
{
"x": 1051.3182393498905,
"y": 4789.671620947022
},
{
"x": 1150.3700510118472,
"y": 5082.700955021085
},
{
"x": 1062.1182240516828,
"y": 4872.343046239983
}
]
}
],
"drilldown": {},
"tooltip": {
"enabled": true,
"useHTML": false,
"format": null,
"headerFormat": "",
"pointFormat": "<span style=\"color:{series.color}\">Single</span>: <b>{point.x:.0f}</b><br><span style=\"color:{series.color}\">Multi</span>: <b>{point.y:.0f}</b>",
"footerFormat": "",
"shared": false,
"outside": false,
"valueDecimals": null,
"split": false
},
"annotations": null
},
"hc_type": "chart",
"id": "177890982980666183254044035278198801970"
}
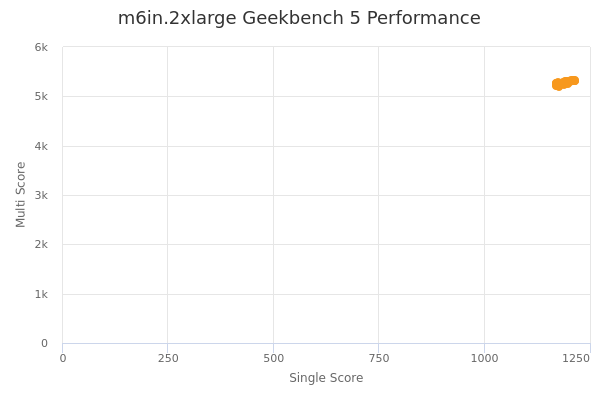
| Single | Multi | |
|---|---|---|
| Max | 1215 | 5333 |
| Average | 1182 | 5234 |
| Deviation | 33.76 | 124.68 |
| Min | 1051 | 4790 |
Sign up as Freemium to get more insight.