m6idn.4xlarge by Amazon Web Services
Geekbench is a cross-platform processor benchmark with a scoring system that determines single-core and multi-core performance using loads simulating real-world scenarios. Geekbench 5 score is calculated with a reference score of 2500 representing the performance of the Intel Core i5-2520M @ 2.50 GHz. The software benchmark is available for Mac OS, Windows, Linux, Android and iOS platforms.
Specifications:
CPU
16
RAM
64.0 GB
Extra
1x
950 GB
SSD
Net
50000 Mbps
{
"configuration": {
"chart": {
"type": "scatter",
"polar": false,
"zoomType": "",
"options3d": {},
"height": null,
"width": null,
"margin": null,
"inverted": false,
"zooming": {}
},
"credits": {
"enabled": false
},
"title": {
"text": ""
},
"colorAxis": null,
"subtitle": {
"text": ""
},
"xAxis": {
"title": {
"text": [
"Single Score"
],
"useHTML": false,
"style": {
"color": "#666666"
}
},
"categories": null,
"lineWidth": 1,
"tickInterval": null,
"tickWidth": 1,
"tickLength": 10,
"tickPixelInterval": 100,
"plotLines": null,
"labels": {
"enabled": true,
"format": null,
"formatter": "",
"style": {
"color": "#666666",
"cursor": "default",
"fontSize": "11px"
},
"useHTML": false,
"step": 0
},
"plotBands": null,
"visible": true,
"floor": null,
"ceiling": null,
"type": "linear",
"min": 0,
"gridLineWidth": 1,
"gridLineColor": "#e6e6e6",
"minorTickInterval": null,
"minorTickWidth": 0,
"minTickInterval": null,
"startOnTick": true,
"endOnTick": true,
"tickmarkPlacement": 100,
"units": 100,
"minRange": 100
},
"yAxis": {
"title": {
"text": [
"Multi Score"
],
"useHTML": false,
"style": {
"color": "#666666"
}
},
"categories": null,
"plotLines": null,
"plotBands": null,
"lineWidth": null,
"tickInterval": null,
"tickLength": 10,
"floor": null,
"ceiling": null,
"gridLineInterpolation": null,
"gridLineWidth": 1,
"gridLineColor": "#e6e6e6",
"min": 0,
"max": null,
"minorTickInterval": null,
"minorTickWidth": 0,
"minTickInterval": null,
"startOnTick": true,
"endOnTick": true,
"minRange": null,
"type": "linear",
"tickmarkPlacement": null,
"labels": {
"enabled": true,
"formatter": null,
"style": {
"color": "#666666",
"cursor": "default",
"fontSize": "11px"
},
"useHTML": false
}
},
"zAxis": {
"title": {
"text": "Multi Score"
}
},
"plotOptions": {
"series": {
"dataLabels": {
"enabled": false,
"format": null,
"distance": 30,
"align": "center",
"inside": null,
"allowOverlap": false,
"style": {
"fontSize": "11px"
}
},
"showInLegend": null,
"turboThreshold": 0,
"stacking": "",
"groupPadding": 0.2,
"centerInCategory": false,
"findNearestPointBy": "x"
}
},
"navigator": {
"enabled": false
},
"scrollbar": {
"enabled": false
},
"rangeSelector": {
"enabled": false,
"inputEnabled": false
},
"legend": {
"enabled": null,
"maxHeight": null,
"align": "center",
"verticalAlign": "bottom",
"layout": "horizontal",
"width": null,
"margin": 12,
"reversed": false
},
"series": [
{
"name": "m6idn.4xlarge by Amazon Web Services",
"color": "#f7981d",
"data": [
{
"x": 1204.357231480137,
"y": 9998.67673275421
},
{
"x": 1124.908281992202,
"y": 9549.111783886065
},
{
"x": 1209.0070885605876,
"y": 10004.200306406186
},
{
"x": 1133.4843189831404,
"y": 9498.98897417509
},
{
"x": 1197.0634776870966,
"y": 9994.460963071477
},
{
"x": 1135.3498917473162,
"y": 9464.93036391557
},
{
"x": 1201.300774979638,
"y": 9987.317720806474
},
{
"x": 1134.1581211206114,
"y": 9503.019665674334
},
{
"x": 1204.0508736145798,
"y": 10030.68079376029
},
{
"x": 1146.2960927546271,
"y": 9575.65111942323
},
{
"x": 1207.7580984503215,
"y": 10019.406002813199
},
{
"x": 1143.6650273694438,
"y": 9582.79326562782
},
{
"x": 1202.4126996104421,
"y": 9952.476814062114
},
{
"x": 1117.8809428691973,
"y": 9480.476640969697
},
{
"x": 1198.085517666203,
"y": 9949.394742594777
},
{
"x": 1147.043704462605,
"y": 9648.511842010414
},
{
"x": 1207.6319740400609,
"y": 10005.508558956906
},
{
"x": 1169.2342792568006,
"y": 9806.660796050623
},
{
"x": 1206.8776953206288,
"y": 10013.458891390332
},
{
"x": 1167.0716124173277,
"y": 9766.134549264443
},
{
"x": 1258.9326910837656,
"y": 10160.550961221541
},
{
"x": 1218.7218371684316,
"y": 10036.76894539153
},
{
"x": 1250.5137271232938,
"y": 10144.391498153973
},
{
"x": 1214.9929805584234,
"y": 10030.557670614073
},
{
"x": 1269.0309953726114,
"y": 10184.84050536996
},
{
"x": 1268.8540705135815,
"y": 10170.012866882043
},
{
"x": 1259.699065759998,
"y": 10142.775728402205
},
{
"x": 1270.778282784106,
"y": 10137.82056105036
},
{
"x": 1233.60545367491,
"y": 10131.22042907702
},
{
"x": 1255.9135536997667,
"y": 10137.437375028525
},
{
"x": 1259.5305344881033,
"y": 10179.283464328191
},
{
"x": 1271.1516652122214,
"y": 10163.322998375283
},
{
"x": 1256.7742416931546,
"y": 10146.8772427671
},
{
"x": 1263.0013202256107,
"y": 10066.29165081054
},
{
"x": 1261.8070184099188,
"y": 10182.554800741887
},
{
"x": 1244.0080447613298,
"y": 10071.120912563043
},
{
"x": 1266.6470034298086,
"y": 10140.06405177408
},
{
"x": 1242.553399930498,
"y": 10084.220449769591
},
{
"x": 1265.597044238636,
"y": 10160.184086236148
},
{
"x": 1254.6640641707897,
"y": 10108.823602369892
}
]
}
],
"drilldown": {},
"tooltip": {
"enabled": true,
"useHTML": false,
"format": null,
"headerFormat": "",
"pointFormat": "<span style=\"color:{series.color}\">Single</span>: <b>{point.x:.0f}</b><br><span style=\"color:{series.color}\">Multi</span>: <b>{point.y:.0f}</b>",
"footerFormat": "",
"shared": false,
"outside": false,
"valueDecimals": null,
"split": false
},
"annotations": null
},
"hc_type": "chart",
"id": "332096139533279341863894917928384722695"
}
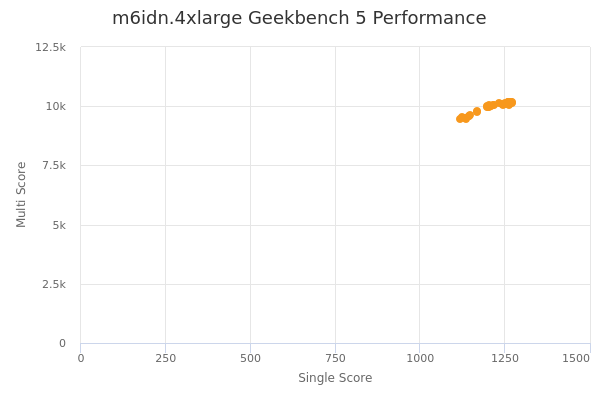
| Single | Multi | |
|---|---|---|
| Max | 1271 | 10185 |
| Average | 1214 | 9960 |
| Deviation | 48.25 | 231.60 |
| Min | 1118 | 9465 |
Sign up as Freemium to get more insight.