m5n.xlarge by Amazon Web Services
Geekbench is a cross-platform processor benchmark with a scoring system that determines single-core and multi-core performance using loads simulating real-world scenarios. Geekbench 5 score is calculated with a reference score of 2500 representing the performance of the Intel Core i5-2520M @ 2.50 GHz. The software benchmark is available for Mac OS, Windows, Linux, Android and iOS platforms.
Specifications:
CPU
4
RAM
16.0 GB
Net
25000 Mbps
{
"configuration": {
"chart": {
"type": "scatter",
"polar": false,
"zoomType": "",
"options3d": {},
"height": null,
"width": null,
"margin": null,
"inverted": false,
"zooming": {}
},
"credits": {
"enabled": false
},
"title": {
"text": ""
},
"colorAxis": null,
"subtitle": {
"text": ""
},
"xAxis": {
"title": {
"text": [
"Single Score"
],
"useHTML": false,
"style": {
"color": "#666666"
}
},
"categories": null,
"lineWidth": 1,
"tickInterval": null,
"tickWidth": 1,
"tickLength": 10,
"tickPixelInterval": 100,
"plotLines": null,
"labels": {
"enabled": true,
"format": null,
"formatter": "",
"style": {
"color": "#666666",
"cursor": "default",
"fontSize": "11px"
},
"useHTML": false,
"step": 0
},
"plotBands": null,
"visible": true,
"floor": null,
"ceiling": null,
"type": "linear",
"min": 0,
"gridLineWidth": 1,
"gridLineColor": "#e6e6e6",
"minorTickInterval": null,
"minorTickWidth": 0,
"minTickInterval": null,
"startOnTick": true,
"endOnTick": true,
"tickmarkPlacement": 100,
"units": 100,
"minRange": 100
},
"yAxis": {
"title": {
"text": [
"Multi Score"
],
"useHTML": false,
"style": {
"color": "#666666"
}
},
"categories": null,
"plotLines": null,
"plotBands": null,
"lineWidth": null,
"tickInterval": null,
"tickLength": 10,
"floor": null,
"ceiling": null,
"gridLineInterpolation": null,
"gridLineWidth": 1,
"gridLineColor": "#e6e6e6",
"min": 0,
"max": null,
"minorTickInterval": null,
"minorTickWidth": 0,
"minTickInterval": null,
"startOnTick": true,
"endOnTick": true,
"minRange": null,
"type": "linear",
"tickmarkPlacement": null,
"labels": {
"enabled": true,
"formatter": null,
"style": {
"color": "#666666",
"cursor": "default",
"fontSize": "11px"
},
"useHTML": false
}
},
"zAxis": {
"title": {
"text": "Multi Score"
}
},
"plotOptions": {
"series": {
"dataLabels": {
"enabled": false,
"format": null,
"distance": 30,
"align": "center",
"inside": null,
"allowOverlap": false,
"style": {
"fontSize": "11px"
}
},
"showInLegend": null,
"turboThreshold": 0,
"stacking": "",
"groupPadding": 0.2,
"centerInCategory": false,
"findNearestPointBy": "x"
}
},
"navigator": {
"enabled": false
},
"scrollbar": {
"enabled": false
},
"rangeSelector": {
"enabled": false,
"inputEnabled": false
},
"legend": {
"enabled": null,
"maxHeight": null,
"align": "center",
"verticalAlign": "bottom",
"layout": "horizontal",
"width": null,
"margin": 12,
"reversed": false
},
"series": [
{
"name": "m5n.xlarge by Amazon Web Services",
"color": "#f7981d",
"data": [
{
"x": 852.0744811872023,
"y": 2005.8911683494505
},
{
"x": 849.780019268401,
"y": 1997.7393539741397
},
{
"x": 851.5859394561052,
"y": 2006.4635822399337
},
{
"x": 845.4574496743094,
"y": 1992.2034081541703
},
{
"x": 853.2631572790491,
"y": 2002.7750466926077
},
{
"x": 849.9831591074294,
"y": 1998.1117636080517
},
{
"x": 854.1963063839598,
"y": 1998.988729307585
},
{
"x": 847.3456697181932,
"y": 1991.350468304149
},
{
"x": 854.5145020081468,
"y": 2001.5737809429352
},
{
"x": 847.7838816407279,
"y": 1998.6073739019414
},
{
"x": 854.6242194265399,
"y": 2035.175935203882
},
{
"x": 872.4590197680865,
"y": 2038.5523454298966
},
{
"x": 877.2899744482982,
"y": 2044.3533584142888
},
{
"x": 858.0024556814565,
"y": 2012.9952037146836
},
{
"x": 871.9054834305512,
"y": 2048.935465915356
},
{
"x": 854.9430267911087,
"y": 2019.6289792444336
},
{
"x": 869.7641405495829,
"y": 2048.8881044034492
},
{
"x": 853.0336954410859,
"y": 2027.6287468552227
},
{
"x": 865.0297580268934,
"y": 2035.5604483918428
},
{
"x": 864.0246180303524,
"y": 2018.2280205043942
},
{
"x": 865.947163373012,
"y": 2038.6216162473215
},
{
"x": 861.2355721232698,
"y": 2021.3301102334026
},
{
"x": 870.0119188825653,
"y": 2033.7255184803948
},
{
"x": 865.4651435908102,
"y": 2029.6987874100257
},
{
"x": 865.7816197421444,
"y": 2031.4604396417444
},
{
"x": 872.0762962379818,
"y": 2032.31337003395
},
{
"x": 867.9818599428268,
"y": 2040.7780595257377
},
{
"x": 868.0506886777916,
"y": 2011.7449754803488
},
{
"x": 867.6186449104662,
"y": 2040.967552479885
},
{
"x": 855.5932683491086,
"y": 2018.9720079722829
}
]
}
],
"drilldown": {},
"tooltip": {
"enabled": true,
"useHTML": false,
"format": null,
"headerFormat": "",
"pointFormat": "<span style=\"color:{series.color}\">Single</span>: <b>{point.x:.0f}</b><br><span style=\"color:{series.color}\">Multi</span>: <b>{point.y:.0f}</b>",
"footerFormat": "",
"shared": false,
"outside": false,
"valueDecimals": null,
"split": false
},
"annotations": null
},
"hc_type": "chart",
"id": "197736892658998230867444490060019870688"
}
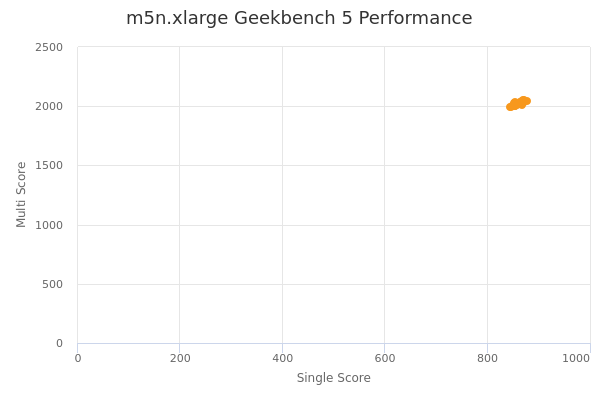
| Single | Multi | |
|---|---|---|
| Max | 877 | 2049 |
| Average | 860 | 2021 |
| Deviation | 8.87 | 17.81 |
| Min | 845 | 1991 |
Sign up as Freemium to get more insight.