m5n.4xlarge by Amazon Web Services
Geekbench is a cross-platform processor benchmark with a scoring system that determines single-core and multi-core performance using loads simulating real-world scenarios. Geekbench 5 score is calculated with a reference score of 2500 representing the performance of the Intel Core i5-2520M @ 2.50 GHz. The software benchmark is available for Mac OS, Windows, Linux, Android and iOS platforms.
Specifications:
CPU
16
RAM
64.0 GB
Net
25000 Mbps
{
"configuration": {
"chart": {
"type": "scatter",
"polar": false,
"zoomType": "",
"options3d": {},
"height": null,
"width": null,
"margin": null,
"inverted": false,
"zooming": {}
},
"credits": {
"enabled": false
},
"title": {
"text": ""
},
"colorAxis": null,
"subtitle": {
"text": ""
},
"xAxis": {
"title": {
"text": [
"Single Score"
],
"useHTML": false,
"style": {
"color": "#666666"
}
},
"categories": null,
"lineWidth": 1,
"tickInterval": null,
"tickWidth": 1,
"tickLength": 10,
"tickPixelInterval": 100,
"plotLines": null,
"labels": {
"enabled": true,
"format": null,
"formatter": "",
"style": {
"color": "#666666",
"cursor": "default",
"fontSize": "11px"
},
"useHTML": false,
"step": 0
},
"plotBands": null,
"visible": true,
"floor": null,
"ceiling": null,
"type": "linear",
"min": 0,
"gridLineWidth": 1,
"gridLineColor": "#e6e6e6",
"minorTickInterval": null,
"minorTickWidth": 0,
"minTickInterval": null,
"startOnTick": true,
"endOnTick": true,
"tickmarkPlacement": 100,
"units": 100,
"minRange": 100
},
"yAxis": {
"title": {
"text": [
"Multi Score"
],
"useHTML": false,
"style": {
"color": "#666666"
}
},
"categories": null,
"plotLines": null,
"plotBands": null,
"lineWidth": null,
"tickInterval": null,
"tickLength": 10,
"floor": null,
"ceiling": null,
"gridLineInterpolation": null,
"gridLineWidth": 1,
"gridLineColor": "#e6e6e6",
"min": 0,
"max": null,
"minorTickInterval": null,
"minorTickWidth": 0,
"minTickInterval": null,
"startOnTick": true,
"endOnTick": true,
"minRange": null,
"type": "linear",
"tickmarkPlacement": null,
"labels": {
"enabled": true,
"formatter": null,
"style": {
"color": "#666666",
"cursor": "default",
"fontSize": "11px"
},
"useHTML": false
}
},
"zAxis": {
"title": {
"text": "Multi Score"
}
},
"plotOptions": {
"series": {
"dataLabels": {
"enabled": false,
"format": null,
"distance": 30,
"align": "center",
"inside": null,
"allowOverlap": false,
"style": {
"fontSize": "11px"
}
},
"showInLegend": null,
"turboThreshold": 0,
"stacking": "",
"groupPadding": 0.2,
"centerInCategory": false,
"findNearestPointBy": "x"
}
},
"navigator": {
"enabled": false
},
"scrollbar": {
"enabled": false
},
"rangeSelector": {
"enabled": false,
"inputEnabled": false
},
"legend": {
"enabled": null,
"maxHeight": null,
"align": "center",
"verticalAlign": "bottom",
"layout": "horizontal",
"width": null,
"margin": 12,
"reversed": false
},
"series": [
{
"name": "m5n.4xlarge by Amazon Web Services",
"color": "#f7981d",
"data": [
{
"x": 904.3034272777552,
"y": 7847.940221100456
},
{
"x": 891.3092004987625,
"y": 7815.825541818114
},
{
"x": 903.0728090003902,
"y": 7841.812956676644
},
{
"x": 892.924472913252,
"y": 7814.298657201118
},
{
"x": 891.4486914911614,
"y": 7824.547890130979
},
{
"x": 902.2055987482681,
"y": 7840.35975716254
},
{
"x": 892.9360949967563,
"y": 7812.314508478177
},
{
"x": 903.3153375566174,
"y": 7839.642277400266
},
{
"x": 902.7171318209053,
"y": 7843.359695147874
},
{
"x": 890.4292040635339,
"y": 7812.0149830652845
},
{
"x": 906.6074202331525,
"y": 7841.131175040664
},
{
"x": 892.587716341711,
"y": 7823.740811108869
},
{
"x": 903.5592891112753,
"y": 7835.401183489168
},
{
"x": 890.448568703944,
"y": 7800.983575362587
},
{
"x": 905.6328418265141,
"y": 7829.614377401629
},
{
"x": 896.8521907164102,
"y": 7810.645651781064
},
{
"x": 902.8389093640924,
"y": 7844.895262358545
},
{
"x": 888.1370441931176,
"y": 7802.404033008468
},
{
"x": 901.236012715986,
"y": 7835.737710390646
},
{
"x": 891.300881578755,
"y": 7825.853287141053
},
{
"x": 898.6808178021955,
"y": 7780.5076747516905
},
{
"x": 884.7384080544691,
"y": 7761.418001158838
},
{
"x": 897.731819256855,
"y": 7776.652972656902
},
{
"x": 889.0997326953642,
"y": 7768.7615832107
},
{
"x": 896.4269191727603,
"y": 7792.19632934965
},
{
"x": 888.2996119560053,
"y": 7734.451606544586
},
{
"x": 898.1328646193417,
"y": 7773.943687227408
},
{
"x": 885.9076868910656,
"y": 7752.251743962752
},
{
"x": 897.8293978972449,
"y": 7782.321932301411
},
{
"x": 882.2210667542554,
"y": 7758.250105840501
},
{
"x": 895.047742815982,
"y": 7797.798443097233
},
{
"x": 887.9288998410659,
"y": 7771.341533585894
},
{
"x": 896.1432145282888,
"y": 7787.072415724077
},
{
"x": 888.717044914777,
"y": 7761.080254207589
},
{
"x": 896.5794057969317,
"y": 7776.129300687733
},
{
"x": 888.8638380840955,
"y": 7763.837926673799
},
{
"x": 895.3816877551865,
"y": 7782.391159545945
},
{
"x": 887.3857997313478,
"y": 7748.561874062023
},
{
"x": 899.0687339668411,
"y": 7773.825760946163
},
{
"x": 887.8673779727942,
"y": 7757.174379856477
}
]
}
],
"drilldown": {},
"tooltip": {
"enabled": true,
"useHTML": false,
"format": null,
"headerFormat": "",
"pointFormat": "<span style=\"color:{series.color}\">Single</span>: <b>{point.x:.0f}</b><br><span style=\"color:{series.color}\">Multi</span>: <b>{point.y:.0f}</b>",
"footerFormat": "",
"shared": false,
"outside": false,
"valueDecimals": null,
"split": false
},
"annotations": null
},
"hc_type": "chart",
"id": "238273853245356220108674666259735067435"
}
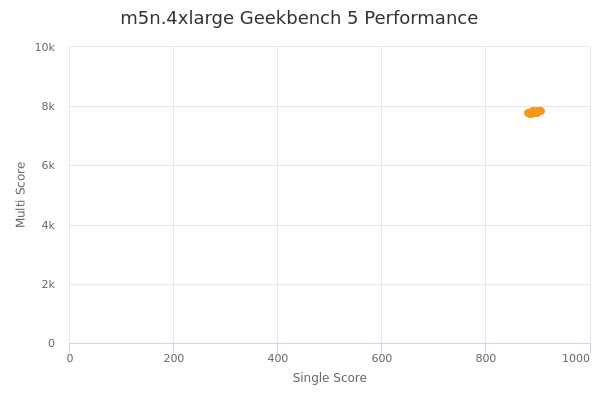
| Single | Multi | |
|---|---|---|
| Max | 907 | 7848 |
| Average | 895 | 7799 |
| Deviation | 6.38 | 32.21 |
| Min | 882 | 7734 |
Sign up as Freemium to get more insight.