h1.4xlarge by Amazon Web Services
Geekbench is a cross-platform processor benchmark with a scoring system that determines single-core and multi-core performance using loads simulating real-world scenarios. Geekbench 5 score is calculated with a reference score of 2500 representing the performance of the Intel Core i5-2520M @ 2.50 GHz. The software benchmark is available for Mac OS, Windows, Linux, Android and iOS platforms.
Specifications:
CPU
16
RAM
64.0 GB
Extra
2x
2000 GB
Magnetic
Net
10000 Mbps
{
"configuration": {
"chart": {
"type": "scatter",
"polar": false,
"zoomType": "",
"options3d": {},
"height": null,
"width": null,
"margin": null,
"inverted": false,
"zooming": {}
},
"credits": {
"enabled": false
},
"title": {
"text": ""
},
"colorAxis": null,
"subtitle": {
"text": ""
},
"xAxis": {
"title": {
"text": [
"Single Score"
],
"useHTML": false,
"style": {
"color": "#666666"
}
},
"categories": null,
"lineWidth": 1,
"tickInterval": null,
"tickWidth": 1,
"tickLength": 10,
"tickPixelInterval": 100,
"plotLines": null,
"labels": {
"enabled": true,
"format": null,
"formatter": "",
"style": {
"color": "#666666",
"cursor": "default",
"fontSize": "11px"
},
"useHTML": false,
"step": 0
},
"plotBands": null,
"visible": true,
"floor": null,
"ceiling": null,
"type": "linear",
"min": 0,
"gridLineWidth": 1,
"gridLineColor": "#e6e6e6",
"minorTickInterval": null,
"minorTickWidth": 0,
"minTickInterval": null,
"startOnTick": true,
"endOnTick": true,
"tickmarkPlacement": 100,
"units": 100,
"minRange": 100
},
"yAxis": {
"title": {
"text": [
"Multi Score"
],
"useHTML": false,
"style": {
"color": "#666666"
}
},
"categories": null,
"plotLines": null,
"plotBands": null,
"lineWidth": null,
"tickInterval": null,
"tickLength": 10,
"floor": null,
"ceiling": null,
"gridLineInterpolation": null,
"gridLineWidth": 1,
"gridLineColor": "#e6e6e6",
"min": 0,
"max": null,
"minorTickInterval": null,
"minorTickWidth": 0,
"minTickInterval": null,
"startOnTick": true,
"endOnTick": true,
"minRange": null,
"type": "linear",
"tickmarkPlacement": null,
"labels": {
"enabled": true,
"formatter": null,
"style": {
"color": "#666666",
"cursor": "default",
"fontSize": "11px"
},
"useHTML": false
}
},
"zAxis": {
"title": {
"text": "Multi Score"
}
},
"plotOptions": {
"series": {
"dataLabels": {
"enabled": false,
"format": null,
"distance": 30,
"align": "center",
"inside": null,
"allowOverlap": false,
"style": {
"fontSize": "11px"
}
},
"showInLegend": null,
"turboThreshold": 0,
"stacking": "",
"groupPadding": 0.2,
"centerInCategory": false,
"findNearestPointBy": "x"
}
},
"navigator": {
"enabled": false
},
"scrollbar": {
"enabled": false
},
"rangeSelector": {
"enabled": false,
"inputEnabled": false
},
"legend": {
"enabled": null,
"maxHeight": null,
"align": "center",
"verticalAlign": "bottom",
"layout": "horizontal",
"width": null,
"margin": 12,
"reversed": false
},
"series": [
{
"name": "h1.4xlarge by Amazon Web Services",
"color": "#f7981d",
"data": [
{
"x": 761.7277326902417,
"y": 6313.588772368654
},
{
"x": 755.2576101561069,
"y": 6318.883630268754
},
{
"x": 763.4633899662036,
"y": 6304.2933067783215
},
{
"x": 759.4229851760592,
"y": 6302.8779577208825
},
{
"x": 763.3052912462616,
"y": 6304.846209247731
},
{
"x": 759.0769534554454,
"y": 6295.662843873124
},
{
"x": 762.441361960889,
"y": 6321.670409634446
},
{
"x": 749.4080425528059,
"y": 6292.422329729846
},
{
"x": 762.4436759930667,
"y": 6315.322865582848
},
{
"x": 761.1046905412456,
"y": 6312.354832125712
},
{
"x": 755.2209877543735,
"y": 6297.633284718391
},
{
"x": 749.7893649462093,
"y": 6298.4959759989715
},
{
"x": 748.9686198352744,
"y": 6279.792385217885
},
{
"x": 761.5592416446418,
"y": 6322.86783598398
},
{
"x": 756.6320958638335,
"y": 6305.70932561651
},
{
"x": 745.4000199861299,
"y": 6301.8434934834095
},
{
"x": 755.0619221821777,
"y": 6320.423373082376
},
{
"x": 749.1656257095175,
"y": 6296.766552540245
},
{
"x": 756.5351167738552,
"y": 6308.566523221483
},
{
"x": 744.4517732689869,
"y": 6310.6082996064
}
]
}
],
"drilldown": {},
"tooltip": {
"enabled": true,
"useHTML": false,
"format": null,
"headerFormat": "",
"pointFormat": "<span style=\"color:{series.color}\">Single</span>: <b>{point.x:.0f}</b><br><span style=\"color:{series.color}\">Multi</span>: <b>{point.y:.0f}</b>",
"footerFormat": "",
"shared": false,
"outside": false,
"valueDecimals": null,
"split": false
},
"annotations": null
},
"hc_type": "chart",
"id": "1226822951539317520095482786689977223"
}
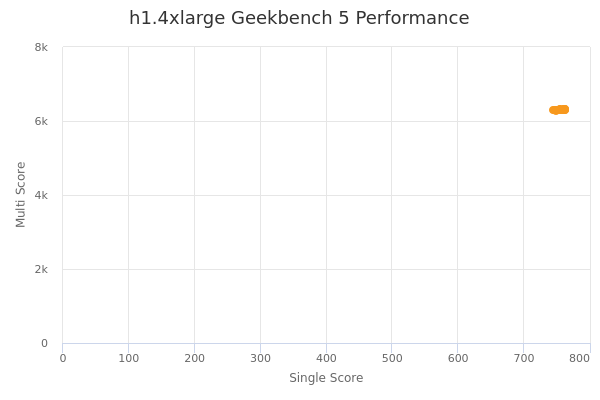
| Single | Multi | |
|---|---|---|
| Max | 763 | 6323 |
| Average | 756 | 6306 |
| Deviation | 6.04 | 10.81 |
| Min | 744 | 6280 |
Sign up as Freemium to get more insight.
- In same series
- h1.2xlarge
- h1.4xlarge
- h1.8xlarge
- h1.16xlarge