h1.2xlarge by Amazon Web Services
Geekbench is a cross-platform processor benchmark with a scoring system that determines single-core and multi-core performance using loads simulating real-world scenarios. Geekbench 5 score is calculated with a reference score of 2500 representing the performance of the Intel Core i5-2520M @ 2.50 GHz. The software benchmark is available for Mac OS, Windows, Linux, Android and iOS platforms.
Specifications:
CPU
8
RAM
32.0 GB
Extra
1x
2000 GB
Magnetic
Net
10000 Mbps
{
"configuration": {
"chart": {
"type": "scatter",
"polar": false,
"zoomType": "",
"options3d": {},
"height": null,
"width": null,
"margin": null,
"inverted": false,
"zooming": {}
},
"credits": {
"enabled": false
},
"title": {
"text": ""
},
"colorAxis": null,
"subtitle": {
"text": ""
},
"xAxis": {
"title": {
"text": [
"Single Score"
],
"useHTML": false,
"style": {
"color": "#666666"
}
},
"categories": null,
"lineWidth": 1,
"tickInterval": null,
"tickWidth": 1,
"tickLength": 10,
"tickPixelInterval": 100,
"plotLines": null,
"labels": {
"enabled": true,
"format": null,
"formatter": "",
"style": {
"color": "#666666",
"cursor": "default",
"fontSize": "11px"
},
"useHTML": false,
"step": 0
},
"plotBands": null,
"visible": true,
"floor": null,
"ceiling": null,
"type": "linear",
"min": 0,
"gridLineWidth": 1,
"gridLineColor": "#e6e6e6",
"minorTickInterval": null,
"minorTickWidth": 0,
"minTickInterval": null,
"startOnTick": true,
"endOnTick": true,
"tickmarkPlacement": 100,
"units": 100,
"minRange": 100
},
"yAxis": {
"title": {
"text": [
"Multi Score"
],
"useHTML": false,
"style": {
"color": "#666666"
}
},
"categories": null,
"plotLines": null,
"plotBands": null,
"lineWidth": null,
"tickInterval": null,
"tickLength": 10,
"floor": null,
"ceiling": null,
"gridLineInterpolation": null,
"gridLineWidth": 1,
"gridLineColor": "#e6e6e6",
"min": 0,
"max": null,
"minorTickInterval": null,
"minorTickWidth": 0,
"minTickInterval": null,
"startOnTick": true,
"endOnTick": true,
"minRange": null,
"type": "linear",
"tickmarkPlacement": null,
"labels": {
"enabled": true,
"formatter": null,
"style": {
"color": "#666666",
"cursor": "default",
"fontSize": "11px"
},
"useHTML": false
}
},
"zAxis": {
"title": {
"text": "Multi Score"
}
},
"plotOptions": {
"series": {
"dataLabels": {
"enabled": false,
"format": null,
"distance": 30,
"align": "center",
"inside": null,
"allowOverlap": false,
"style": {
"fontSize": "11px"
}
},
"showInLegend": null,
"turboThreshold": 0,
"stacking": "",
"groupPadding": 0.2,
"centerInCategory": false,
"findNearestPointBy": "x"
}
},
"navigator": {
"enabled": false
},
"scrollbar": {
"enabled": false
},
"rangeSelector": {
"enabled": false,
"inputEnabled": false
},
"legend": {
"enabled": null,
"maxHeight": null,
"align": "center",
"verticalAlign": "bottom",
"layout": "horizontal",
"width": null,
"margin": 12,
"reversed": false
},
"series": [
{
"name": "h1.2xlarge by Amazon Web Services",
"color": "#f7981d",
"data": [
{
"x": 758.4361319682923,
"y": 3351.431848622979
},
{
"x": 757.3871875251875,
"y": 3337.607306376459
},
{
"x": 756.7710977647004,
"y": 3353.3382145663354
},
{
"x": 754.875219662238,
"y": 3331.4301025001414
},
{
"x": 756.7685852244053,
"y": 3352.170072144723
},
{
"x": 754.5620040691678,
"y": 3337.2507008158577
},
{
"x": 756.2770527676997,
"y": 3344.604052986966
},
{
"x": 752.7709197546637,
"y": 3332.172515874745
},
{
"x": 755.0213664116559,
"y": 3346.848083759413
},
{
"x": 755.2256321559471,
"y": 3332.454288040927
},
{
"x": 758.71119869321,
"y": 3341.7356100308543
},
{
"x": 757.4561242019274,
"y": 3334.993621353645
},
{
"x": 755.2009476267359,
"y": 3350.9443000320693
},
{
"x": 746.5033853554214,
"y": 3333.465468478121
},
{
"x": 745.6589576730647,
"y": 3317.9293467426423
},
{
"x": 748.4503008745864,
"y": 3320.4092525301453
},
{
"x": 738.0603607534381,
"y": 3323.415090431292
},
{
"x": 746.5316940762543,
"y": 3328.8422754401854
},
{
"x": 742.0963470975672,
"y": 3340.161883045448
},
{
"x": 754.3168685347803,
"y": 3338.175831352576
}
]
}
],
"drilldown": {},
"tooltip": {
"enabled": true,
"useHTML": false,
"format": null,
"headerFormat": "",
"pointFormat": "<span style=\"color:{series.color}\">Single</span>: <b>{point.x:.0f}</b><br><span style=\"color:{series.color}\">Multi</span>: <b>{point.y:.0f}</b>",
"footerFormat": "",
"shared": false,
"outside": false,
"valueDecimals": null,
"split": false
},
"annotations": null
},
"hc_type": "chart",
"id": "189060559656835078056421640724623375226"
}
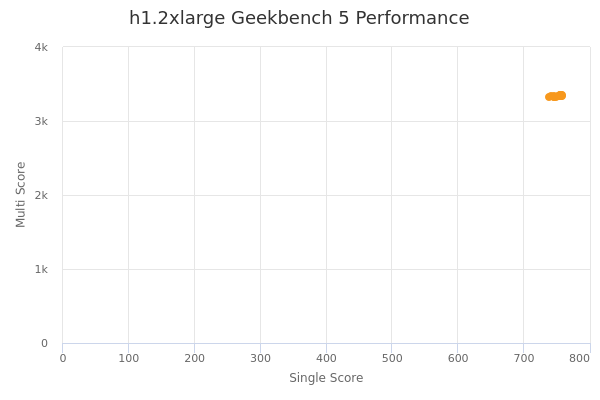
| Single | Multi | |
|---|---|---|
| Max | 759 | 3353 |
| Average | 753 | 3337 |
| Deviation | 5.74 | 10.16 |
| Min | 738 | 3318 |
Sign up as Freemium to get more insight.
- In same series
- h1.2xlarge
- h1.4xlarge
- h1.8xlarge
- h1.16xlarge