g5.xlarge by Amazon Web Services
Geekbench is a cross-platform processor benchmark with a scoring system that determines single-core and multi-core performance using loads simulating real-world scenarios. Geekbench 5 score is calculated with a reference score of 2500 representing the performance of the Intel Core i5-2520M @ 2.50 GHz. The software benchmark is available for Mac OS, Windows, Linux, Android and iOS platforms.
Specifications:
CPU
4
RAM
16.0 GB
GPU
1
Extra
1x
250 GB
NVMe SSD
Net
10000 Mbps
{
"configuration": {
"chart": {
"type": "scatter",
"polar": false,
"zoomType": "",
"options3d": {},
"height": null,
"width": null,
"margin": null,
"inverted": false,
"zooming": {}
},
"credits": {
"enabled": false
},
"title": {
"text": ""
},
"colorAxis": null,
"subtitle": {
"text": ""
},
"xAxis": {
"title": {
"text": [
"Single Score"
],
"useHTML": false,
"style": {
"color": "#666666"
}
},
"categories": null,
"lineWidth": 1,
"tickInterval": null,
"tickWidth": 1,
"tickLength": 10,
"tickPixelInterval": 100,
"plotLines": null,
"labels": {
"enabled": true,
"format": null,
"formatter": "",
"style": {
"color": "#666666",
"cursor": "default",
"fontSize": "11px"
},
"useHTML": false,
"step": 0
},
"plotBands": null,
"visible": true,
"floor": null,
"ceiling": null,
"type": "linear",
"min": 0,
"gridLineWidth": 1,
"gridLineColor": "#e6e6e6",
"minorTickInterval": null,
"minorTickWidth": 0,
"minTickInterval": null,
"startOnTick": true,
"endOnTick": true,
"tickmarkPlacement": 100,
"units": 100,
"minRange": 100
},
"yAxis": {
"title": {
"text": [
"Multi Score"
],
"useHTML": false,
"style": {
"color": "#666666"
}
},
"categories": null,
"plotLines": null,
"plotBands": null,
"lineWidth": null,
"tickInterval": null,
"tickLength": 10,
"floor": null,
"ceiling": null,
"gridLineInterpolation": null,
"gridLineWidth": 1,
"gridLineColor": "#e6e6e6",
"min": 0,
"max": null,
"minorTickInterval": null,
"minorTickWidth": 0,
"minTickInterval": null,
"startOnTick": true,
"endOnTick": true,
"minRange": null,
"type": "linear",
"tickmarkPlacement": null,
"labels": {
"enabled": true,
"formatter": null,
"style": {
"color": "#666666",
"cursor": "default",
"fontSize": "11px"
},
"useHTML": false
}
},
"zAxis": {
"title": {
"text": "Multi Score"
}
},
"plotOptions": {
"series": {
"dataLabels": {
"enabled": false,
"format": null,
"distance": 30,
"align": "center",
"inside": null,
"allowOverlap": false,
"style": {
"fontSize": "11px"
}
},
"showInLegend": null,
"turboThreshold": 0,
"stacking": "",
"groupPadding": 0.2,
"centerInCategory": false,
"findNearestPointBy": "x"
}
},
"navigator": {
"enabled": false
},
"scrollbar": {
"enabled": false
},
"rangeSelector": {
"enabled": false,
"inputEnabled": false
},
"legend": {
"enabled": null,
"maxHeight": null,
"align": "center",
"verticalAlign": "bottom",
"layout": "horizontal",
"width": null,
"margin": 12,
"reversed": false
},
"series": [
{
"name": "g5.xlarge by Amazon Web Services",
"color": "#f7981d",
"data": [
{
"x": 1029.2518111557674,
"y": 2479.950515501209
},
{
"x": 1024.8932239563096,
"y": 2476.363561796921
},
{
"x": 1028.06595176272,
"y": 2458.379972263264
},
{
"x": 1024.5913880492026,
"y": 2470.8386122716574
},
{
"x": 1027.0162553514979,
"y": 2462.2262612581276
},
{
"x": 1027.3758775188928,
"y": 2456.218727575063
},
{
"x": 1025.3659493546231,
"y": 2478.5258229171545
},
{
"x": 1025.6942672531957,
"y": 2464.974400076616
},
{
"x": 1030.2415484372036,
"y": 2473.5017157556317
},
{
"x": 1028.1183068796288,
"y": 2472.4934612994275
},
{
"x": 1025.1863906112012,
"y": 2460.128466282274
},
{
"x": 1024.5134672577701,
"y": 2478.5311504678434
},
{
"x": 1025.318915556899,
"y": 2463.841479056522
},
{
"x": 1025.4166744738511,
"y": 2475.6634019815187
},
{
"x": 1024.8590830059925,
"y": 2455.2121629761928
},
{
"x": 1027.253958457741,
"y": 2460.598516493994
},
{
"x": 1027.0316571424858,
"y": 2473.5042450238975
},
{
"x": 1023.5449746395552,
"y": 2479.584787899457
},
{
"x": 1025.1123825715429,
"y": 2463.29726541081
},
{
"x": 1028.2541959454459,
"y": 2478.4187491148473
},
{
"x": 1033.5436062254048,
"y": 2474.6803505146386
},
{
"x": 1026.1745129826556,
"y": 2474.380196863005
},
{
"x": 1026.6416337391383,
"y": 2471.6243185966687
},
{
"x": 1026.198849753907,
"y": 2464.245431200961
},
{
"x": 1032.5286854046117,
"y": 2481.9670092538536
},
{
"x": 1025.1084261821688,
"y": 2460.1135440885755
},
{
"x": 1032.1949712501846,
"y": 2473.4840564090496
},
{
"x": 1023.3198776942263,
"y": 2470.4182534594356
},
{
"x": 1029.5163241008477,
"y": 2493.671684583984
},
{
"x": 1024.7821141773356,
"y": 2478.2766051169
},
{
"x": 1030.0423593055514,
"y": 2466.386170260974
},
{
"x": 1022.8253808914385,
"y": 2460.8269936994193
},
{
"x": 1027.5818797205388,
"y": 2479.7016826359413
},
{
"x": 1024.448320769439,
"y": 2464.5887147267968
},
{
"x": 1028.946791801863,
"y": 2476.7833676975893
},
{
"x": 1028.3434443672409,
"y": 2475.363336801684
},
{
"x": 1029.04706366793,
"y": 2482.6742189659208
},
{
"x": 1024.148039011398,
"y": 2467.168864392112
},
{
"x": 1029.1715228842477,
"y": 2470.172024313917
},
{
"x": 1021.9918604020324,
"y": 2454.656184021833
}
]
}
],
"drilldown": {},
"tooltip": {
"enabled": true,
"useHTML": false,
"format": null,
"headerFormat": "",
"pointFormat": "<span style=\"color:{series.color}\">Single</span>: <b>{point.x:.0f}</b><br><span style=\"color:{series.color}\">Multi</span>: <b>{point.y:.0f}</b>",
"footerFormat": "",
"shared": false,
"outside": false,
"valueDecimals": null,
"split": false
},
"annotations": null
},
"hc_type": "chart",
"id": "235398902007863039784559324461134865312"
}
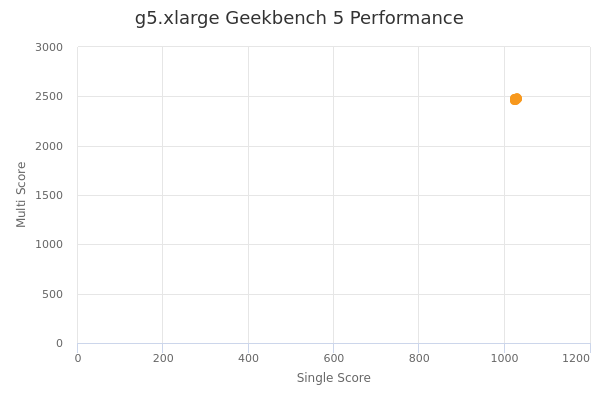
| Single | Multi | |
|---|---|---|
| Max | 1034 | 2494 |
| Average | 1027 | 2471 |
| Deviation | 2.64 | 8.74 |
| Min | 1022 | 2455 |
Sign up as Freemium to get more insight.
- In same series
- g5.xlarge
- g5.2xlarge
- g5.4xlarge
- g5.8xlarge
- g5.12xlarge
- g5.16xlarge
- g5.24xlarge
- g5.48xlarge