g5.2xlarge by Amazon Web Services
Geekbench is a cross-platform processor benchmark with a scoring system that determines single-core and multi-core performance using loads simulating real-world scenarios. Geekbench 5 score is calculated with a reference score of 2500 representing the performance of the Intel Core i5-2520M @ 2.50 GHz. The software benchmark is available for Mac OS, Windows, Linux, Android and iOS platforms.
Specifications:
CPU
8
RAM
32.0 GB
GPU
1
NVIDIA A10G
Extra
1x
450 GB
NVMe SSD
Net
10000 Mbps
{
"configuration": {
"chart": {
"type": "scatter",
"polar": false,
"zoomType": "",
"options3d": {},
"height": null,
"width": null,
"margin": null,
"inverted": false,
"zooming": {}
},
"credits": {
"enabled": false
},
"title": {
"text": ""
},
"colorAxis": null,
"subtitle": {
"text": ""
},
"xAxis": {
"title": {
"text": [
"Single Score"
],
"useHTML": false,
"style": {
"color": "#666666"
}
},
"categories": null,
"lineWidth": 1,
"tickInterval": null,
"tickWidth": 1,
"tickLength": 10,
"tickPixelInterval": 100,
"plotLines": null,
"labels": {
"enabled": true,
"format": null,
"formatter": "",
"style": {
"color": "#666666",
"cursor": "default",
"fontSize": "11px"
},
"useHTML": false,
"step": 0
},
"plotBands": null,
"visible": true,
"floor": null,
"ceiling": null,
"type": "linear",
"min": 0,
"gridLineWidth": 1,
"gridLineColor": "#e6e6e6",
"minorTickInterval": null,
"minorTickWidth": 0,
"minTickInterval": null,
"startOnTick": true,
"endOnTick": true,
"tickmarkPlacement": 100,
"units": 100,
"minRange": 100
},
"yAxis": {
"title": {
"text": [
"Multi Score"
],
"useHTML": false,
"style": {
"color": "#666666"
}
},
"categories": null,
"plotLines": null,
"plotBands": null,
"lineWidth": null,
"tickInterval": null,
"tickLength": 10,
"floor": null,
"ceiling": null,
"gridLineInterpolation": null,
"gridLineWidth": 1,
"gridLineColor": "#e6e6e6",
"min": 0,
"max": null,
"minorTickInterval": null,
"minorTickWidth": 0,
"minTickInterval": null,
"startOnTick": true,
"endOnTick": true,
"minRange": null,
"type": "linear",
"tickmarkPlacement": null,
"labels": {
"enabled": true,
"formatter": null,
"style": {
"color": "#666666",
"cursor": "default",
"fontSize": "11px"
},
"useHTML": false
}
},
"zAxis": {
"title": {
"text": "Multi Score"
}
},
"plotOptions": {
"series": {
"dataLabels": {
"enabled": false,
"format": null,
"distance": 30,
"align": "center",
"inside": null,
"allowOverlap": false,
"style": {
"fontSize": "11px"
}
},
"showInLegend": null,
"turboThreshold": 0,
"stacking": "",
"groupPadding": 0.2,
"centerInCategory": false,
"findNearestPointBy": "x"
}
},
"navigator": {
"enabled": false
},
"scrollbar": {
"enabled": false
},
"rangeSelector": {
"enabled": false,
"inputEnabled": false
},
"legend": {
"enabled": null,
"maxHeight": null,
"align": "center",
"verticalAlign": "bottom",
"layout": "horizontal",
"width": null,
"margin": 12,
"reversed": false
},
"series": [
{
"name": "g5.2xlarge by Amazon Web Services",
"color": "#f7981d",
"data": [
{
"x": 1062.860625526279,
"y": 4700.551075256079
},
{
"x": 1029.7686731925623,
"y": 4662.357414288648
},
{
"x": 1058.7653465527483,
"y": 4707.1778095692425
},
{
"x": 1033.0997179857202,
"y": 4697.461004198459
},
{
"x": 1058.4141743575399,
"y": 4763.111988198414
},
{
"x": 1034.5216435943048,
"y": 4657.218563525657
},
{
"x": 1055.6142156121182,
"y": 4688.471124410526
},
{
"x": 1028.492701119559,
"y": 4684.792612894045
},
{
"x": 1053.4293397282468,
"y": 4761.39619090722
},
{
"x": 1031.2700776585011,
"y": 4681.718872861807
},
{
"x": 1056.2727559627162,
"y": 4751.30888233294
},
{
"x": 1033.4675579831062,
"y": 4661.092678997611
},
{
"x": 1057.0111001218,
"y": 4671.921111005707
},
{
"x": 1030.9437930118113,
"y": 4668.664817078767
},
{
"x": 1058.8718822024662,
"y": 4723.754987942877
},
{
"x": 1035.144970658508,
"y": 4705.413001121648
},
{
"x": 1055.83950326535,
"y": 4729.580062956989
},
{
"x": 1030.524149381292,
"y": 4683.089161488552
},
{
"x": 1056.3590231596072,
"y": 4762.228294100009
},
{
"x": 1030.2448043419442,
"y": 4655.501520435342
}
]
}
],
"drilldown": {},
"tooltip": {
"enabled": true,
"useHTML": false,
"format": null,
"headerFormat": "",
"pointFormat": "<span style=\"color:{series.color}\">Single</span>: <b>{point.x:.0f}</b><br><span style=\"color:{series.color}\">Multi</span>: <b>{point.y:.0f}</b>",
"footerFormat": "",
"shared": false,
"outside": false,
"valueDecimals": null,
"split": false
},
"annotations": null
},
"hc_type": "chart",
"id": "221722337382135606340957080910953618902"
}
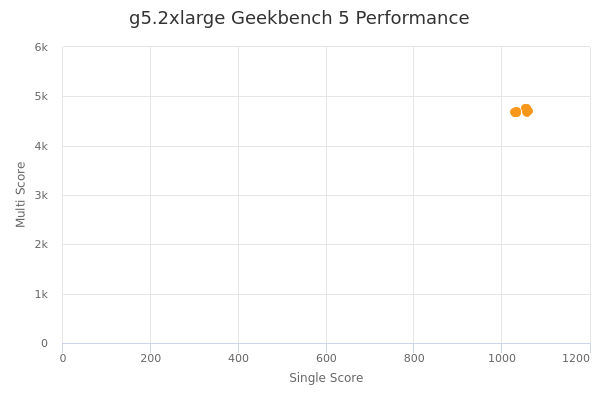
| Single | Multi | |
|---|---|---|
| Max | 1063 | 4763 |
| Average | 1045 | 4701 |
| Deviation | 13.00 | 35.54 |
| Min | 1028 | 4656 |
Sign up as Freemium to get more insight.
- In same series
- g5.xlarge
- g5.2xlarge
- g5.4xlarge
- g5.8xlarge
- g5.12xlarge
- g5.16xlarge
- g5.24xlarge
- g5.48xlarge