d3en.xlarge by Amazon Web Services
Geekbench is a cross-platform processor benchmark with a scoring system that determines single-core and multi-core performance using loads simulating real-world scenarios. Geekbench 5 score is calculated with a reference score of 2500 representing the performance of the Intel Core i5-2520M @ 2.50 GHz. The software benchmark is available for Mac OS, Windows, Linux, Android and iOS platforms.
Specifications:
CPU
4
RAM
16.0 GB
Extra
2x
14000 GB
Magnetic
Net
25000 Mbps
{
"configuration": {
"chart": {
"type": "scatter",
"polar": false,
"zoomType": "",
"options3d": {},
"height": null,
"width": null,
"margin": null,
"inverted": false,
"zooming": {}
},
"credits": {
"enabled": false
},
"title": {
"text": ""
},
"colorAxis": null,
"subtitle": {
"text": ""
},
"xAxis": {
"title": {
"text": [
"Single Score"
],
"useHTML": false,
"style": {
"color": "#666666"
}
},
"categories": null,
"lineWidth": 1,
"tickInterval": null,
"tickWidth": 1,
"tickLength": 10,
"tickPixelInterval": 100,
"plotLines": null,
"labels": {
"enabled": true,
"format": null,
"formatter": "",
"style": {
"color": "#666666",
"cursor": "default",
"fontSize": "11px"
},
"useHTML": false,
"step": 0
},
"plotBands": null,
"visible": true,
"floor": null,
"ceiling": null,
"type": "linear",
"min": 0,
"gridLineWidth": 1,
"gridLineColor": "#e6e6e6",
"minorTickInterval": null,
"minorTickWidth": 0,
"minTickInterval": null,
"startOnTick": true,
"endOnTick": true,
"tickmarkPlacement": 100,
"units": 100,
"minRange": 100
},
"yAxis": {
"title": {
"text": [
"Multi Score"
],
"useHTML": false,
"style": {
"color": "#666666"
}
},
"categories": null,
"plotLines": null,
"plotBands": null,
"lineWidth": null,
"tickInterval": null,
"tickLength": 10,
"floor": null,
"ceiling": null,
"gridLineInterpolation": null,
"gridLineWidth": 1,
"gridLineColor": "#e6e6e6",
"min": 0,
"max": null,
"minorTickInterval": null,
"minorTickWidth": 0,
"minTickInterval": null,
"startOnTick": true,
"endOnTick": true,
"minRange": null,
"type": "linear",
"tickmarkPlacement": null,
"labels": {
"enabled": true,
"formatter": null,
"style": {
"color": "#666666",
"cursor": "default",
"fontSize": "11px"
},
"useHTML": false
}
},
"zAxis": {
"title": {
"text": "Multi Score"
}
},
"plotOptions": {
"series": {
"dataLabels": {
"enabled": false,
"format": null,
"distance": 30,
"align": "center",
"inside": null,
"allowOverlap": false,
"style": {
"fontSize": "11px"
}
},
"showInLegend": null,
"turboThreshold": 0,
"stacking": "",
"groupPadding": 0.2,
"centerInCategory": false,
"findNearestPointBy": "x"
}
},
"navigator": {
"enabled": false
},
"scrollbar": {
"enabled": false
},
"rangeSelector": {
"enabled": false,
"inputEnabled": false
},
"legend": {
"enabled": null,
"maxHeight": null,
"align": "center",
"verticalAlign": "bottom",
"layout": "horizontal",
"width": null,
"margin": 12,
"reversed": false
},
"series": [
{
"name": "d3en.xlarge by Amazon Web Services",
"color": "#f7981d",
"data": [
{
"x": 912.0730915437312,
"y": 2096.7583110973123
},
{
"x": 908.4396429636647,
"y": 2103.4828312632985
},
{
"x": 911.3298625114703,
"y": 2098.208283612021
},
{
"x": 913.6592626959755,
"y": 2101.9122948755216
},
{
"x": 911.4203767581805,
"y": 2097.347560726642
},
{
"x": 913.3561050754198,
"y": 2088.3630860237126
},
{
"x": 910.3776829797811,
"y": 2094.4180907925047
},
{
"x": 912.2544308523125,
"y": 2085.4224691628315
},
{
"x": 910.9326840406305,
"y": 2097.774995697974
},
{
"x": 909.0315080371702,
"y": 2089.3405263694663
},
{
"x": 912.0915733905777,
"y": 2098.419603516617
},
{
"x": 913.136835805537,
"y": 2086.2464527299453
},
{
"x": 910.766218888554,
"y": 2098.11938315911
},
{
"x": 913.0075955663253,
"y": 2087.7320043834725
},
{
"x": 908.0761226141298,
"y": 2096.141195504426
},
{
"x": 913.4503118301659,
"y": 2083.3320158858487
},
{
"x": 912.6000468522202,
"y": 2096.034362086308
},
{
"x": 913.7164609305253,
"y": 2101.794862222676
},
{
"x": 911.2141282260679,
"y": 2092.5464378687698
},
{
"x": 913.3193542452098,
"y": 2089.0275290288505
},
{
"x": 912.4821464911785,
"y": 2103.5311700068414
},
{
"x": 912.8118172948957,
"y": 2090.839266381484
},
{
"x": 911.2315978203799,
"y": 2099.789584540881
},
{
"x": 909.8444693765892,
"y": 2089.881767348028
},
{
"x": 912.4416358429023,
"y": 2093.0243654466785
},
{
"x": 913.5853760460661,
"y": 2103.9521674251355
},
{
"x": 911.1794657881235,
"y": 2099.2761793868376
},
{
"x": 912.2121740417608,
"y": 2089.058662278476
},
{
"x": 911.0749225195182,
"y": 2098.53202148371
},
{
"x": 913.0260861830409,
"y": 2082.177854088154
},
{
"x": 910.6255628524209,
"y": 2094.630917812411
},
{
"x": 913.8905825403552,
"y": 2086.465726251096
},
{
"x": 911.0570649946342,
"y": 2097.127867592347
},
{
"x": 912.4542994991373,
"y": 2091.4415243586745
},
{
"x": 911.8055721918372,
"y": 2092.1921499898126
},
{
"x": 913.6642105889771,
"y": 2100.5011910634144
},
{
"x": 911.986509599782,
"y": 2093.150299086233
},
{
"x": 913.2685751192187,
"y": 2087.9200595631
},
{
"x": 910.3275001761925,
"y": 2099.8235857973573
},
{
"x": 912.678521013131,
"y": 2088.346732386233
}
]
}
],
"drilldown": {},
"tooltip": {
"enabled": true,
"useHTML": false,
"format": null,
"headerFormat": "",
"pointFormat": "<span style=\"color:{series.color}\">Single</span>: <b>{point.x:.0f}</b><br><span style=\"color:{series.color}\">Multi</span>: <b>{point.y:.0f}</b>",
"footerFormat": "",
"shared": false,
"outside": false,
"valueDecimals": null,
"split": false
},
"annotations": null
},
"hc_type": "chart",
"id": "232631456499744897958322389948913676570"
}
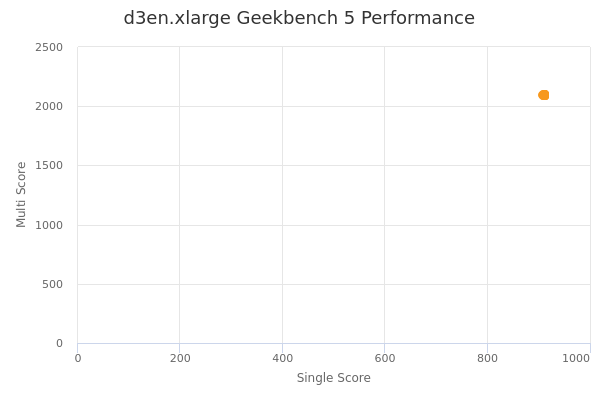
| Single | Multi | |
|---|---|---|
| Max | 914 | 2104 |
| Average | 912 | 2094 |
| Deviation | 1.44 | 5.84 |
| Min | 908 | 2082 |
Sign up as Freemium to get more insight.
- In same series
- d3en.xlarge
- d3en.2xlarge
- d3en.4xlarge
- d3en.6xlarge
- d3en.8xlarge
- d3en.12xlarge