d3en.12xlarge by Amazon Web Services
Geekbench is a cross-platform processor benchmark with a scoring system that determines single-core and multi-core performance using loads simulating real-world scenarios. Geekbench 5 score is calculated with a reference score of 2500 representing the performance of the Intel Core i5-2520M @ 2.50 GHz. The software benchmark is available for Mac OS, Windows, Linux, Android and iOS platforms.
Specifications:
CPU
48
RAM
192.0 GB
Extra
24x
14000 GB
Magnetic
Net
75000 Mbps
{
"configuration": {
"chart": {
"type": "scatter",
"polar": false,
"zoomType": "",
"options3d": {},
"height": null,
"width": null,
"margin": null,
"inverted": false,
"zooming": {}
},
"credits": {
"enabled": false
},
"title": {
"text": ""
},
"colorAxis": null,
"subtitle": {
"text": ""
},
"xAxis": {
"title": {
"text": [
"Single Score"
],
"useHTML": false,
"style": {
"color": "#666666"
}
},
"categories": null,
"lineWidth": 1,
"tickInterval": null,
"tickWidth": 1,
"tickLength": 10,
"tickPixelInterval": 100,
"plotLines": null,
"labels": {
"enabled": true,
"format": null,
"formatter": "",
"style": {
"color": "#666666",
"cursor": "default",
"fontSize": "11px"
},
"useHTML": false,
"step": 0
},
"plotBands": null,
"visible": true,
"floor": null,
"ceiling": null,
"type": "linear",
"min": 0,
"gridLineWidth": 1,
"gridLineColor": "#e6e6e6",
"minorTickInterval": null,
"minorTickWidth": 0,
"minTickInterval": null,
"startOnTick": true,
"endOnTick": true,
"tickmarkPlacement": 100,
"units": 100,
"minRange": 100
},
"yAxis": {
"title": {
"text": [
"Multi Score"
],
"useHTML": false,
"style": {
"color": "#666666"
}
},
"categories": null,
"plotLines": null,
"plotBands": null,
"lineWidth": null,
"tickInterval": null,
"tickLength": 10,
"floor": null,
"ceiling": null,
"gridLineInterpolation": null,
"gridLineWidth": 1,
"gridLineColor": "#e6e6e6",
"min": 0,
"max": null,
"minorTickInterval": null,
"minorTickWidth": 0,
"minTickInterval": null,
"startOnTick": true,
"endOnTick": true,
"minRange": null,
"type": "linear",
"tickmarkPlacement": null,
"labels": {
"enabled": true,
"formatter": null,
"style": {
"color": "#666666",
"cursor": "default",
"fontSize": "11px"
},
"useHTML": false
}
},
"zAxis": {
"title": {
"text": "Multi Score"
}
},
"plotOptions": {
"series": {
"dataLabels": {
"enabled": false,
"format": null,
"distance": 30,
"align": "center",
"inside": null,
"allowOverlap": false,
"style": {
"fontSize": "11px"
}
},
"showInLegend": null,
"turboThreshold": 0,
"stacking": "",
"groupPadding": 0.2,
"centerInCategory": false,
"findNearestPointBy": "x"
}
},
"navigator": {
"enabled": false
},
"scrollbar": {
"enabled": false
},
"rangeSelector": {
"enabled": false,
"inputEnabled": false
},
"legend": {
"enabled": null,
"maxHeight": null,
"align": "center",
"verticalAlign": "bottom",
"layout": "horizontal",
"width": null,
"margin": 12,
"reversed": false
},
"series": [
{
"name": "d3en.12xlarge by Amazon Web Services",
"color": "#f7981d",
"data": [
{
"x": 965.3968021762164,
"y": 19931.758012862658
},
{
"x": 965.9537417056265,
"y": 19834.471722295926
},
{
"x": 967.0551115206366,
"y": 19849.908135418947
},
{
"x": 965.490707654181,
"y": 19828.3219127522
},
{
"x": 967.6533868485449,
"y": 19806.13248023702
},
{
"x": 964.0410931540066,
"y": 19785.19568924701
},
{
"x": 965.6086950995431,
"y": 19843.15553321875
},
{
"x": 964.6365014054502,
"y": 19900.757877346136
},
{
"x": 966.9771249509886,
"y": 19794.29072948087
},
{
"x": 965.1487810439869,
"y": 19921.497608302496
},
{
"x": 966.132966902835,
"y": 19841.548079895998
},
{
"x": 965.4195312330705,
"y": 19791.425066311633
},
{
"x": 966.5922667527456,
"y": 19759.612614248326
},
{
"x": 963.5179573252618,
"y": 19798.92973367269
},
{
"x": 967.226642160265,
"y": 19858.12656774667
},
{
"x": 963.7993256294217,
"y": 19882.62175613261
},
{
"x": 967.7875447967094,
"y": 19897.337686694373
},
{
"x": 962.9065327414244,
"y": 19865.132327609997
},
{
"x": 964.8441735729641,
"y": 19851.528355573224
},
{
"x": 963.3824885152578,
"y": 19848.681263525912
}
]
}
],
"drilldown": {},
"tooltip": {
"enabled": true,
"useHTML": false,
"format": null,
"headerFormat": "",
"pointFormat": "<span style=\"color:{series.color}\">Single</span>: <b>{point.x:.0f}</b><br><span style=\"color:{series.color}\">Multi</span>: <b>{point.y:.0f}</b>",
"footerFormat": "",
"shared": false,
"outside": false,
"valueDecimals": null,
"split": false
},
"annotations": null
},
"hc_type": "chart",
"id": "271350645337164807684387642322996272661"
}
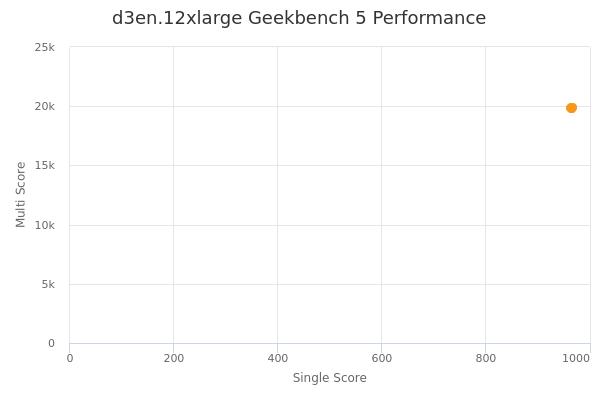
| Single | Multi | |
|---|---|---|
| Max | 968 | 19932 |
| Average | 965 | 19845 |
| Deviation | 1.43 | 45.63 |
| Min | 963 | 19760 |
Sign up as Freemium to get more insight.
- In same series
- d3en.xlarge
- d3en.2xlarge
- d3en.4xlarge
- d3en.6xlarge
- d3en.8xlarge
- d3en.12xlarge