d3.8xlarge by Amazon Web Services
Geekbench is a cross-platform processor benchmark with a scoring system that determines single-core and multi-core performance using loads simulating real-world scenarios. Geekbench 5 score is calculated with a reference score of 2500 representing the performance of the Intel Core i5-2520M @ 2.50 GHz. The software benchmark is available for Mac OS, Windows, Linux, Android and iOS platforms.
Specifications:
CPU
32
RAM
256.0 GB
Extra
24x
2000 GB
Magnetic
Net
25000 Mbps
{
"configuration": {
"chart": {
"type": "scatter",
"polar": false,
"zoomType": "",
"options3d": {},
"height": null,
"width": null,
"margin": null,
"inverted": false,
"zooming": {}
},
"credits": {
"enabled": false
},
"title": {
"text": ""
},
"colorAxis": null,
"subtitle": {
"text": ""
},
"xAxis": {
"title": {
"text": [
"Single Score"
],
"useHTML": false,
"style": {
"color": "#666666"
}
},
"categories": null,
"lineWidth": 1,
"tickInterval": null,
"tickWidth": 1,
"tickLength": 10,
"tickPixelInterval": 100,
"plotLines": null,
"labels": {
"enabled": true,
"format": null,
"formatter": "",
"style": {
"color": "#666666",
"cursor": "default",
"fontSize": "11px"
},
"useHTML": false,
"step": 0
},
"plotBands": null,
"visible": true,
"floor": null,
"ceiling": null,
"type": "linear",
"min": 0,
"gridLineWidth": 1,
"gridLineColor": "#e6e6e6",
"minorTickInterval": null,
"minorTickWidth": 0,
"minTickInterval": null,
"startOnTick": true,
"endOnTick": true,
"tickmarkPlacement": 100,
"units": 100,
"minRange": 100
},
"yAxis": {
"title": {
"text": [
"Multi Score"
],
"useHTML": false,
"style": {
"color": "#666666"
}
},
"categories": null,
"plotLines": null,
"plotBands": null,
"lineWidth": null,
"tickInterval": null,
"tickLength": 10,
"floor": null,
"ceiling": null,
"gridLineInterpolation": null,
"gridLineWidth": 1,
"gridLineColor": "#e6e6e6",
"min": 0,
"max": null,
"minorTickInterval": null,
"minorTickWidth": 0,
"minTickInterval": null,
"startOnTick": true,
"endOnTick": true,
"minRange": null,
"type": "linear",
"tickmarkPlacement": null,
"labels": {
"enabled": true,
"formatter": null,
"style": {
"color": "#666666",
"cursor": "default",
"fontSize": "11px"
},
"useHTML": false
}
},
"zAxis": {
"title": {
"text": "Multi Score"
}
},
"plotOptions": {
"series": {
"dataLabels": {
"enabled": false,
"format": null,
"distance": 30,
"align": "center",
"inside": null,
"allowOverlap": false,
"style": {
"fontSize": "11px"
}
},
"showInLegend": null,
"turboThreshold": 0,
"stacking": "",
"groupPadding": 0.2,
"centerInCategory": false,
"findNearestPointBy": "x"
}
},
"navigator": {
"enabled": false
},
"scrollbar": {
"enabled": false
},
"rangeSelector": {
"enabled": false,
"inputEnabled": false
},
"legend": {
"enabled": null,
"maxHeight": null,
"align": "center",
"verticalAlign": "bottom",
"layout": "horizontal",
"width": null,
"margin": 12,
"reversed": false
},
"series": [
{
"name": "d3.8xlarge by Amazon Web Services",
"color": "#f7981d",
"data": [
{
"x": 916.1182910330066,
"y": 14677.807902475866
},
{
"x": 913.2942269140067,
"y": 14675.260090865078
},
{
"x": 913.0153345966128,
"y": 14736.496063257895
},
{
"x": 911.5484813324288,
"y": 14687.540371658482
},
{
"x": 914.5576161642698,
"y": 14732.102156823978
},
{
"x": 911.6996003202114,
"y": 14698.10489278178
},
{
"x": 909.042940215958,
"y": 14711.672638651338
},
{
"x": 911.9545384589039,
"y": 14642.091521025104
},
{
"x": 908.1429818756425,
"y": 14671.634203000855
},
{
"x": 911.6740396594289,
"y": 14685.819958520975
},
{
"x": 915.5304874929293,
"y": 14709.971182199315
},
{
"x": 911.5905208531019,
"y": 14637.547340681249
},
{
"x": 909.6716415166838,
"y": 14723.809394156133
},
{
"x": 912.0389738852034,
"y": 14679.734842997752
},
{
"x": 915.8046551702453,
"y": 14749.096708281388
},
{
"x": 912.2270386876239,
"y": 14663.273103685717
},
{
"x": 908.7938900224228,
"y": 14675.285763184935
},
{
"x": 912.1961892682025,
"y": 14679.021207986101
},
{
"x": 909.9700612174898,
"y": 14687.845010067558
},
{
"x": 914.5622245640616,
"y": 14713.00941666064
}
]
}
],
"drilldown": {},
"tooltip": {
"enabled": true,
"useHTML": false,
"format": null,
"headerFormat": "",
"pointFormat": "<span style=\"color:{series.color}\">Single</span>: <b>{point.x:.0f}</b><br><span style=\"color:{series.color}\">Multi</span>: <b>{point.y:.0f}</b>",
"footerFormat": "",
"shared": false,
"outside": false,
"valueDecimals": null,
"split": false
},
"annotations": null
},
"hc_type": "chart",
"id": "79727017483226798083543433802421149585"
}
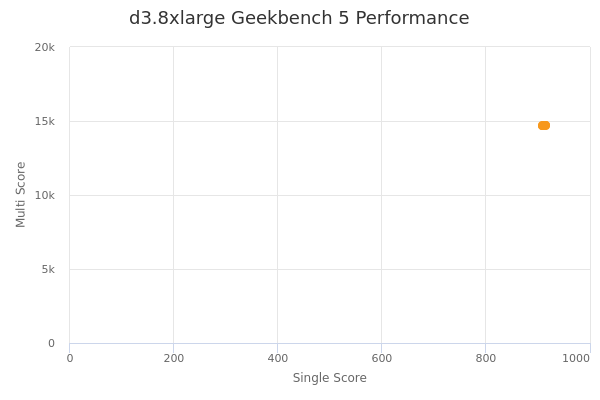
| Single | Multi | |
|---|---|---|
| Max | 916 | 14749 |
| Average | 912 | 14692 |
| Deviation | 2.27 | 29.07 |
| Min | 908 | 14638 |
Sign up as Freemium to get more insight.
- In same series
- d3.xlarge
- d3.2xlarge
- d3.4xlarge
- d3.8xlarge