d3.4xlarge by Amazon Web Services
Geekbench is a cross-platform processor benchmark with a scoring system that determines single-core and multi-core performance using loads simulating real-world scenarios. Geekbench 5 score is calculated with a reference score of 2500 representing the performance of the Intel Core i5-2520M @ 2.50 GHz. The software benchmark is available for Mac OS, Windows, Linux, Android and iOS platforms.
Specifications:
CPU
16
RAM
128.0 GB
Extra
12x
2000 GB
Magnetic
Net
15000 Mbps
{
"configuration": {
"chart": {
"type": "scatter",
"polar": false,
"zoomType": "",
"options3d": {},
"height": null,
"width": null,
"margin": null,
"inverted": false,
"zooming": {}
},
"credits": {
"enabled": false
},
"title": {
"text": ""
},
"colorAxis": null,
"subtitle": {
"text": ""
},
"xAxis": {
"title": {
"text": [
"Single Score"
],
"useHTML": false,
"style": {
"color": "#666666"
}
},
"categories": null,
"lineWidth": 1,
"tickInterval": null,
"tickWidth": 1,
"tickLength": 10,
"tickPixelInterval": 100,
"plotLines": null,
"labels": {
"enabled": true,
"format": null,
"formatter": "",
"style": {
"color": "#666666",
"cursor": "default",
"fontSize": "11px"
},
"useHTML": false,
"step": 0
},
"plotBands": null,
"visible": true,
"floor": null,
"ceiling": null,
"type": "linear",
"min": 0,
"gridLineWidth": 1,
"gridLineColor": "#e6e6e6",
"minorTickInterval": null,
"minorTickWidth": 0,
"minTickInterval": null,
"startOnTick": true,
"endOnTick": true,
"tickmarkPlacement": 100,
"units": 100,
"minRange": 100
},
"yAxis": {
"title": {
"text": [
"Multi Score"
],
"useHTML": false,
"style": {
"color": "#666666"
}
},
"categories": null,
"plotLines": null,
"plotBands": null,
"lineWidth": null,
"tickInterval": null,
"tickLength": 10,
"floor": null,
"ceiling": null,
"gridLineInterpolation": null,
"gridLineWidth": 1,
"gridLineColor": "#e6e6e6",
"min": 0,
"max": null,
"minorTickInterval": null,
"minorTickWidth": 0,
"minTickInterval": null,
"startOnTick": true,
"endOnTick": true,
"minRange": null,
"type": "linear",
"tickmarkPlacement": null,
"labels": {
"enabled": true,
"formatter": null,
"style": {
"color": "#666666",
"cursor": "default",
"fontSize": "11px"
},
"useHTML": false
}
},
"zAxis": {
"title": {
"text": "Multi Score"
}
},
"plotOptions": {
"series": {
"dataLabels": {
"enabled": false,
"format": null,
"distance": 30,
"align": "center",
"inside": null,
"allowOverlap": false,
"style": {
"fontSize": "11px"
}
},
"showInLegend": null,
"turboThreshold": 0,
"stacking": "",
"groupPadding": 0.2,
"centerInCategory": false,
"findNearestPointBy": "x"
}
},
"navigator": {
"enabled": false
},
"scrollbar": {
"enabled": false
},
"rangeSelector": {
"enabled": false,
"inputEnabled": false
},
"legend": {
"enabled": null,
"maxHeight": null,
"align": "center",
"verticalAlign": "bottom",
"layout": "horizontal",
"width": null,
"margin": 12,
"reversed": false
},
"series": [
{
"name": "d3.4xlarge by Amazon Web Services",
"color": "#f7981d",
"data": [
{
"x": 898.6245962351765,
"y": 7938.728659644181
},
{
"x": 891.8041049403505,
"y": 7853.296147600091
},
{
"x": 894.629803988194,
"y": 7911.080975814053
},
{
"x": 892.0361474353782,
"y": 7873.356052386488
},
{
"x": 894.4910709143649,
"y": 7948.111682346375
},
{
"x": 893.457937785134,
"y": 7842.493772707623
},
{
"x": 895.8360444400382,
"y": 7951.534035959563
},
{
"x": 884.6153407243385,
"y": 7848.734169026948
},
{
"x": 892.9193561944122,
"y": 7954.062939883224
},
{
"x": 891.0361653371963,
"y": 7832.404584654172
},
{
"x": 895.9874637741394,
"y": 7973.429897919053
},
{
"x": 895.5131947774651,
"y": 7857.0433113223535
},
{
"x": 897.9486909028813,
"y": 7970.265466944784
},
{
"x": 891.0110314117824,
"y": 7868.776201990964
},
{
"x": 893.6439044491112,
"y": 7963.8267764964985
},
{
"x": 890.6624669149692,
"y": 7872.244961680207
},
{
"x": 893.3006119134559,
"y": 7936.308103523825
},
{
"x": 894.6389998796184,
"y": 7812.272722978559
},
{
"x": 896.4178639939048,
"y": 7927.718661243435
},
{
"x": 893.6945981272597,
"y": 7850.404591102253
}
]
}
],
"drilldown": {},
"tooltip": {
"enabled": true,
"useHTML": false,
"format": null,
"headerFormat": "",
"pointFormat": "<span style=\"color:{series.color}\">Single</span>: <b>{point.x:.0f}</b><br><span style=\"color:{series.color}\">Multi</span>: <b>{point.y:.0f}</b>",
"footerFormat": "",
"shared": false,
"outside": false,
"valueDecimals": null,
"split": false
},
"annotations": null
},
"hc_type": "chart",
"id": "142475318445030937479931248162559115546"
}
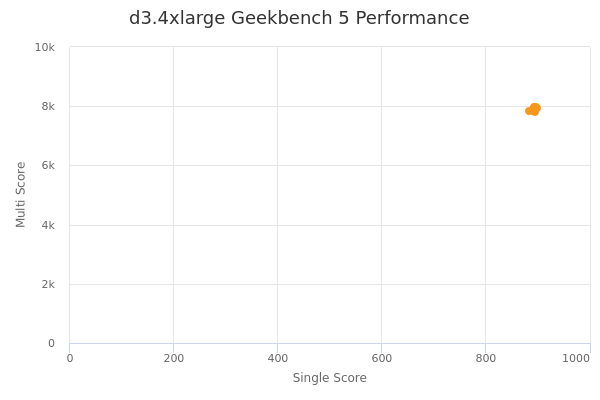
| Single | Multi | |
|---|---|---|
| Max | 899 | 7973 |
| Average | 894 | 7899 |
| Deviation | 2.99 | 51.54 |
| Min | 885 | 7812 |
Sign up as Freemium to get more insight.
- In same series
- d3.xlarge
- d3.2xlarge
- d3.4xlarge
- d3.8xlarge