16CPU 64GB VOC-G 320GB NVMe by Vultr
Geekbench is a cross-platform processor benchmark with a scoring system that determines single-core and multi-core performance using loads simulating real-world scenarios. Geekbench 5 score is calculated with a reference score of 2500 representing the performance of the Intel Core i5-2520M @ 2.50 GHz. The software benchmark is available for Mac OS, Windows, Linux, Android and iOS platforms.
Specifications:
CPU
16
RAM
64.0 GB
Root
320 GB
16CPU 64GB VOC-G 320GB NVMe root
{
"configuration": {
"chart": {
"type": "scatter",
"polar": false,
"zoomType": "",
"options3d": {},
"height": null,
"width": null,
"margin": null,
"inverted": false,
"zooming": {}
},
"credits": {
"enabled": false
},
"title": {
"text": ""
},
"colorAxis": null,
"subtitle": {
"text": ""
},
"xAxis": {
"title": {
"text": [
"Single Score"
],
"useHTML": false,
"style": {
"color": "#666666"
}
},
"categories": null,
"lineWidth": 1,
"tickInterval": null,
"tickWidth": 1,
"tickLength": 10,
"tickPixelInterval": 100,
"plotLines": null,
"labels": {
"enabled": true,
"format": null,
"formatter": "",
"style": {
"color": "#666666",
"cursor": "default",
"fontSize": "11px"
},
"useHTML": false,
"step": 0
},
"plotBands": null,
"visible": true,
"floor": null,
"ceiling": null,
"type": "linear",
"min": 0,
"gridLineWidth": 1,
"gridLineColor": "#e6e6e6",
"minorTickInterval": null,
"minorTickWidth": 0,
"minTickInterval": null,
"startOnTick": true,
"endOnTick": true,
"tickmarkPlacement": 100,
"units": 100,
"minRange": 100
},
"yAxis": {
"title": {
"text": [
"Multi Score"
],
"useHTML": false,
"style": {
"color": "#666666"
}
},
"categories": null,
"plotLines": null,
"plotBands": null,
"lineWidth": null,
"tickInterval": null,
"tickLength": 10,
"floor": null,
"ceiling": null,
"gridLineInterpolation": null,
"gridLineWidth": 1,
"gridLineColor": "#e6e6e6",
"min": 0,
"max": null,
"minorTickInterval": null,
"minorTickWidth": 0,
"minTickInterval": null,
"startOnTick": true,
"endOnTick": true,
"minRange": null,
"type": "linear",
"tickmarkPlacement": null,
"labels": {
"enabled": true,
"formatter": null,
"style": {
"color": "#666666",
"cursor": "default",
"fontSize": "11px"
},
"useHTML": false
}
},
"zAxis": {
"title": {
"text": "Multi Score"
}
},
"plotOptions": {
"series": {
"dataLabels": {
"enabled": false,
"format": null,
"distance": 30,
"align": "center",
"inside": null,
"allowOverlap": false,
"style": {
"fontSize": "11px"
}
},
"showInLegend": null,
"turboThreshold": 0,
"stacking": "",
"groupPadding": 0.2,
"centerInCategory": false,
"findNearestPointBy": "x"
}
},
"navigator": {
"enabled": false
},
"scrollbar": {
"enabled": false
},
"rangeSelector": {
"enabled": false,
"inputEnabled": false
},
"legend": {
"enabled": null,
"maxHeight": null,
"align": "center",
"verticalAlign": "bottom",
"layout": "horizontal",
"width": null,
"margin": 12,
"reversed": false
},
"series": [
{
"name": "16CPU 64GB VOC-G 320GB NVMe by Vultr",
"color": "#3AB1F2",
"data": [
{
"x": 943.0425605050198,
"y": 12591.775218474515
},
{
"x": 906.2834412815703,
"y": 11629.93070184597
},
{
"x": 927.3116087231194,
"y": 12797.462082397335
},
{
"x": 851.1955578884542,
"y": 12107.185419360634
},
{
"x": 945.2943665162599,
"y": 12702.676266243632
},
{
"x": 916.71140709267,
"y": 12044.996801738544
},
{
"x": 947.2698856813603,
"y": 12853.009393577613
},
{
"x": 906.4530738665619,
"y": 11903.144756151607
},
{
"x": 933.2363928155542,
"y": 12798.213806650747
},
{
"x": 908.8446149699517,
"y": 12165.397168461423
},
{
"x": 933.7420138730972,
"y": 12525.042192160949
},
{
"x": 873.6764831799829,
"y": 12043.036924637407
},
{
"x": 931.8060659792816,
"y": 12584.941606214572
},
{
"x": 907.8760910244242,
"y": 11821.90777883571
},
{
"x": 929.6206946429968,
"y": 12669.620372954632
},
{
"x": 900.6336746340423,
"y": 12588.13918887237
},
{
"x": 912.1882935604408,
"y": 12509.701538078361
},
{
"x": 911.0586868162304,
"y": 12382.66553877575
},
{
"x": 908.4270623492262,
"y": 12680.508599336254
},
{
"x": 898.9249069318519,
"y": 11972.243088880281
}
]
}
],
"drilldown": {},
"tooltip": {
"enabled": true,
"useHTML": false,
"format": null,
"headerFormat": "",
"pointFormat": "<span style=\"color:{series.color}\">Single</span>: <b>{point.x:.0f}</b><br><span style=\"color:{series.color}\">Multi</span>: <b>{point.y:.0f}</b>",
"footerFormat": "",
"shared": false,
"outside": false,
"valueDecimals": null,
"split": false
},
"annotations": null
},
"hc_type": "chart",
"id": "127963949453841285578935703210087434863"
}
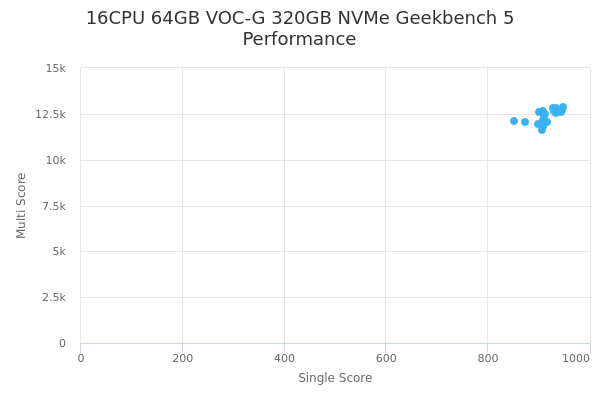
| Single | Multi | |
|---|---|---|
| Max | 947 | 12853 |
| Average | 915 | 12369 |
| Deviation | 23.05 | 362.67 |
| Min | 851 | 11630 |
Sign up as Freemium to get more insight.