1CPU 1GB VHP-AMD 25GB NVMe by Vultr
Geekbench is a cross-platform processor benchmark with a scoring system that determines single-core and multi-core performance using loads simulating real-world scenarios. Geekbench 5 score is calculated with a reference score of 2500 representing the performance of the Intel Core i5-2520M @ 2.50 GHz. The software benchmark is available for Mac OS, Windows, Linux, Android and iOS platforms.
Specifications:
CPU
1
RAM
1.0 GB
Root
25 GB
1CPU 1GB VHP-AMD 25GB NVMe root
{
"configuration": {
"chart": {
"type": "scatter",
"polar": false,
"zoomType": "",
"options3d": {},
"height": null,
"width": null,
"margin": null,
"inverted": false,
"zooming": {}
},
"credits": {
"enabled": false
},
"title": {
"text": ""
},
"colorAxis": null,
"subtitle": {
"text": ""
},
"xAxis": {
"title": {
"text": [
"Single Score"
],
"useHTML": false,
"style": {
"color": "#666666"
}
},
"categories": null,
"lineWidth": 1,
"tickInterval": null,
"tickWidth": 1,
"tickLength": 10,
"tickPixelInterval": 100,
"plotLines": null,
"labels": {
"enabled": true,
"format": null,
"formatter": "",
"style": {
"color": "#666666",
"cursor": "default",
"fontSize": "11px"
},
"useHTML": false,
"step": 0
},
"plotBands": null,
"visible": true,
"floor": null,
"ceiling": null,
"type": "linear",
"min": 0,
"gridLineWidth": 1,
"gridLineColor": "#e6e6e6",
"minorTickInterval": null,
"minorTickWidth": 0,
"minTickInterval": null,
"startOnTick": true,
"endOnTick": true,
"tickmarkPlacement": 100,
"units": 100,
"minRange": 100
},
"yAxis": {
"title": {
"text": [
"Multi Score"
],
"useHTML": false,
"style": {
"color": "#666666"
}
},
"categories": null,
"plotLines": null,
"plotBands": null,
"lineWidth": null,
"tickInterval": null,
"tickLength": 10,
"floor": null,
"ceiling": null,
"gridLineInterpolation": null,
"gridLineWidth": 1,
"gridLineColor": "#e6e6e6",
"min": 0,
"max": null,
"minorTickInterval": null,
"minorTickWidth": 0,
"minTickInterval": null,
"startOnTick": true,
"endOnTick": true,
"minRange": null,
"type": "linear",
"tickmarkPlacement": null,
"labels": {
"enabled": true,
"formatter": null,
"style": {
"color": "#666666",
"cursor": "default",
"fontSize": "11px"
},
"useHTML": false
}
},
"zAxis": {
"title": {
"text": "Multi Score"
}
},
"plotOptions": {
"series": {
"dataLabels": {
"enabled": false,
"format": null,
"distance": 30,
"align": "center",
"inside": null,
"allowOverlap": false,
"style": {
"fontSize": "11px"
}
},
"showInLegend": null,
"turboThreshold": 0,
"stacking": "",
"groupPadding": 0.2,
"centerInCategory": false,
"findNearestPointBy": "x"
}
},
"navigator": {
"enabled": false
},
"scrollbar": {
"enabled": false
},
"rangeSelector": {
"enabled": false,
"inputEnabled": false
},
"legend": {
"enabled": null,
"maxHeight": null,
"align": "center",
"verticalAlign": "bottom",
"layout": "horizontal",
"width": null,
"margin": 12,
"reversed": false
},
"series": [
{
"name": "1CPU 1GB VHP-AMD 25GB NVMe by Vultr",
"color": "#3AB1F2",
"data": [
{
"x": 886.2624900311704,
"y": 861.2905992756257
},
{
"x": 853.9677168879914,
"y": 868.2228504708571
},
{
"x": 880.5765710993496,
"y": 884.1539205086245
},
{
"x": 845.0045744632731,
"y": 856.3120473995621
},
{
"x": 877.6153220094047,
"y": 864.0209505683674
},
{
"x": 818.8177329226512,
"y": 842.784550228885
},
{
"x": 893.440508947521,
"y": 844.3666507205968
},
{
"x": 879.132587421288,
"y": 852.6337158334516
},
{
"x": 872.4843555324999,
"y": 839.4633643698797
},
{
"x": 865.3036754564514,
"y": 830.6370244678226
},
{
"x": 881.3747506198761,
"y": 841.5786928756072
},
{
"x": 843.6714536092968,
"y": 786.162682915135
},
{
"x": 815.8318582979639,
"y": 754.3439980518301
},
{
"x": 861.3685351706742,
"y": 760.3814884368057
},
{
"x": 845.1514020921549,
"y": 770.8722581874745
},
{
"x": 868.5445676163954,
"y": 780.6050031305167
},
{
"x": 732.6036411106901,
"y": 682.2155235294172
},
{
"x": 748.490331622583,
"y": 719.8489575059614
},
{
"x": 761.419769361381,
"y": 698.3561009088817
},
{
"x": 740.0579757298615,
"y": 700.5960265469258
},
{
"x": 708.737481353317,
"y": 795.8464525169734
},
{
"x": 697.5168888269691,
"y": 774.2310992851985
},
{
"x": 707.8544150050277,
"y": 827.3150220878821
},
{
"x": 739.7201706457192,
"y": 812.994882545618
},
{
"x": 789.4213308865255,
"y": 765.1204990456706
},
{
"x": 791.019948472426,
"y": 769.2162228608743
},
{
"x": 832.2830928499731,
"y": 751.6314455424802
},
{
"x": 788.4051187571188,
"y": 762.2417778308184
},
{
"x": 803.4580252236497,
"y": 791.2271032747824
},
{
"x": 803.5917917436104,
"y": 804.6972696901985
},
{
"x": 807.5694887847408,
"y": 759.2898087693914
},
{
"x": 783.3404608518869,
"y": 805.0860895887872
},
{
"x": 843.6257358851975,
"y": 841.9248113341183
},
{
"x": 828.9863738720862,
"y": 832.8908388526816
},
{
"x": 877.8155376096166,
"y": 837.5906777011512
},
{
"x": 869.5709067983535,
"y": 844.2193064266805
},
{
"x": 847.2583462838586,
"y": 889.795783567293
},
{
"x": 823.7167050158275,
"y": 897.3776088071306
},
{
"x": 877.6960562041187,
"y": 912.0763376147277
},
{
"x": 806.579261925034,
"y": 872.3937759056289
}
]
}
],
"drilldown": {},
"tooltip": {
"enabled": true,
"useHTML": false,
"format": null,
"headerFormat": "",
"pointFormat": "<span style=\"color:{series.color}\">Single</span>: <b>{point.x:.0f}</b><br><span style=\"color:{series.color}\">Multi</span>: <b>{point.y:.0f}</b>",
"footerFormat": "",
"shared": false,
"outside": false,
"valueDecimals": null,
"split": false
},
"annotations": null
},
"hc_type": "chart",
"id": "221246631706063466715385192413883598690"
}
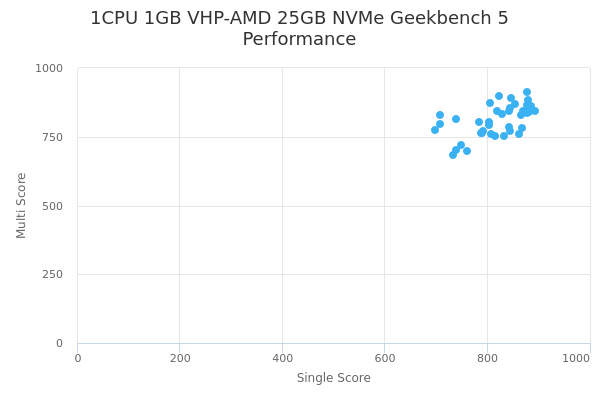
| Single | Multi | |
|---|---|---|
| Max | 893 | 912 |
| Average | 820 | 810 |
| Deviation | 54.90 | 56.19 |
| Min | 698 | 682 |
Sign up as Freemium to get more insight.