v3-starter-8 by VEXXHOST
Geekbench is a cross-platform processor benchmark with a scoring system that determines single-core and multi-core performance using loads simulating real-world scenarios. Geekbench 5 score is calculated with a reference score of 2500 representing the performance of the Intel Core i5-2520M @ 2.50 GHz. The software benchmark is available for Mac OS, Windows, Linux, Android and iOS platforms.
Specifications:
CPU
8
RAM
16.0 GB
Root
80 GB
Local root SSD v3
{
"configuration": {
"chart": {
"type": "scatter",
"polar": false,
"zoomType": "",
"options3d": {},
"height": null,
"width": null,
"margin": null,
"inverted": false,
"zooming": {}
},
"credits": {
"enabled": false
},
"title": {
"text": ""
},
"colorAxis": null,
"subtitle": {
"text": ""
},
"xAxis": {
"title": {
"text": [
"Single Score"
],
"useHTML": false,
"style": {
"color": "#666666"
}
},
"categories": null,
"lineWidth": 1,
"tickInterval": null,
"tickWidth": 1,
"tickLength": 10,
"tickPixelInterval": 100,
"plotLines": null,
"labels": {
"enabled": true,
"format": null,
"formatter": "",
"style": {
"color": "#666666",
"cursor": "default",
"fontSize": "11px"
},
"useHTML": false,
"step": 0
},
"plotBands": null,
"visible": true,
"floor": null,
"ceiling": null,
"type": "linear",
"min": 0,
"gridLineWidth": 1,
"gridLineColor": "#e6e6e6",
"minorTickInterval": null,
"minorTickWidth": 0,
"minTickInterval": null,
"startOnTick": true,
"endOnTick": true,
"tickmarkPlacement": 100,
"units": 100,
"minRange": 100
},
"yAxis": {
"title": {
"text": [
"Multi Score"
],
"useHTML": false,
"style": {
"color": "#666666"
}
},
"categories": null,
"plotLines": null,
"plotBands": null,
"lineWidth": null,
"tickInterval": null,
"tickLength": 10,
"floor": null,
"ceiling": null,
"gridLineInterpolation": null,
"gridLineWidth": 1,
"gridLineColor": "#e6e6e6",
"min": 0,
"max": null,
"minorTickInterval": null,
"minorTickWidth": 0,
"minTickInterval": null,
"startOnTick": true,
"endOnTick": true,
"minRange": null,
"type": "linear",
"tickmarkPlacement": null,
"labels": {
"enabled": true,
"formatter": null,
"style": {
"color": "#666666",
"cursor": "default",
"fontSize": "11px"
},
"useHTML": false
}
},
"zAxis": {
"title": {
"text": "Multi Score"
}
},
"plotOptions": {
"series": {
"dataLabels": {
"enabled": false,
"format": null,
"distance": 30,
"align": "center",
"inside": null,
"allowOverlap": false,
"style": {
"fontSize": "11px"
}
},
"showInLegend": null,
"turboThreshold": 0,
"stacking": "",
"groupPadding": 0.2,
"centerInCategory": false,
"findNearestPointBy": "x"
}
},
"navigator": {
"enabled": false
},
"scrollbar": {
"enabled": false
},
"rangeSelector": {
"enabled": false,
"inputEnabled": false
},
"legend": {
"enabled": null,
"maxHeight": null,
"align": "center",
"verticalAlign": "bottom",
"layout": "horizontal",
"width": null,
"margin": 12,
"reversed": false
},
"series": [
{
"name": "v3-starter-8 by VEXXHOST",
"color": "#6536FF",
"data": [
{
"x": 975.1511348971254,
"y": 6868.656601041448
},
{
"x": 966.9633183282604,
"y": 6757.515837795541
},
{
"x": 967.0182269601505,
"y": 6849.764331273784
},
{
"x": 964.6479772526102,
"y": 6730.770305000599
},
{
"x": 974.0696427772202,
"y": 7058.392723771571
},
{
"x": 977.496281808883,
"y": 6581.154873405718
},
{
"x": 985.9732174639917,
"y": 6868.471457230538
},
{
"x": 951.501008889018,
"y": 6684.880345534241
},
{
"x": 985.5225003542741,
"y": 6633.25885178773
},
{
"x": 954.6064686339912,
"y": 6776.123556870645
},
{
"x": 959.8515194704628,
"y": 6907.494360016373
},
{
"x": 942.6387890507035,
"y": 6652.1349071492095
},
{
"x": 978.9400933989533,
"y": 6786.684291096608
},
{
"x": 975.1902093161472,
"y": 6717.31321648103
},
{
"x": 948.3079451183219,
"y": 6771.558167128733
},
{
"x": 943.9862384950711,
"y": 6581.049415770622
},
{
"x": 969.4718421522084,
"y": 6828.589428659818
},
{
"x": 972.008387269645,
"y": 6829.397042471322
},
{
"x": 978.2172035390716,
"y": 6892.812429154925
},
{
"x": 963.479507174316,
"y": 6842.381950132673
}
]
}
],
"drilldown": {},
"tooltip": {
"enabled": true,
"useHTML": false,
"format": null,
"headerFormat": "",
"pointFormat": "<span style=\"color:{series.color}\">Single</span>: <b>{point.x:.0f}</b><br><span style=\"color:{series.color}\">Multi</span>: <b>{point.y:.0f}</b>",
"footerFormat": "",
"shared": false,
"outside": false,
"valueDecimals": null,
"split": false
},
"annotations": null
},
"hc_type": "chart",
"id": "311680090304022860108869345297835224888"
}
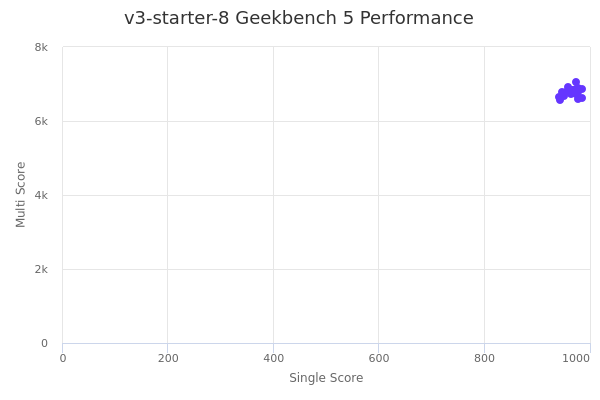
| Single | Multi | |
|---|---|---|
| Max | 986 | 7058 |
| Average | 967 | 6781 |
| Deviation | 12.71 | 115.92 |
| Min | 943 | 6581 |
Sign up as Freemium to get more insight.