v2-standard-1 by VEXXHOST
Geekbench is a cross-platform processor benchmark with a scoring system that determines single-core and multi-core performance using loads simulating real-world scenarios. Geekbench 5 score is calculated with a reference score of 2500 representing the performance of the Intel Core i5-2520M @ 2.50 GHz. The software benchmark is available for Mac OS, Windows, Linux, Android and iOS platforms.
Specifications:
CPU
1
RAM
4.0 GB
{
"configuration": {
"chart": {
"type": "scatter",
"polar": false,
"zoomType": "",
"options3d": {},
"height": null,
"width": null,
"margin": null,
"inverted": false,
"zooming": {}
},
"credits": {
"enabled": false
},
"title": {
"text": ""
},
"colorAxis": null,
"subtitle": {
"text": ""
},
"xAxis": {
"title": {
"text": [
"Single Score"
],
"useHTML": false,
"style": {
"color": "#666666"
}
},
"categories": null,
"lineWidth": 1,
"tickInterval": null,
"tickWidth": 1,
"tickLength": 10,
"tickPixelInterval": 100,
"plotLines": null,
"labels": {
"enabled": true,
"format": null,
"formatter": "",
"style": {
"color": "#666666",
"cursor": "default",
"fontSize": "11px"
},
"useHTML": false,
"step": 0
},
"plotBands": null,
"visible": true,
"floor": null,
"ceiling": null,
"type": "linear",
"min": 0,
"gridLineWidth": 1,
"gridLineColor": "#e6e6e6",
"minorTickInterval": null,
"minorTickWidth": 0,
"minTickInterval": null,
"startOnTick": true,
"endOnTick": true,
"tickmarkPlacement": 100,
"units": 100,
"minRange": 100
},
"yAxis": {
"title": {
"text": [
"Multi Score"
],
"useHTML": false,
"style": {
"color": "#666666"
}
},
"categories": null,
"plotLines": null,
"plotBands": null,
"lineWidth": null,
"tickInterval": null,
"tickLength": 10,
"floor": null,
"ceiling": null,
"gridLineInterpolation": null,
"gridLineWidth": 1,
"gridLineColor": "#e6e6e6",
"min": 0,
"max": null,
"minorTickInterval": null,
"minorTickWidth": 0,
"minTickInterval": null,
"startOnTick": true,
"endOnTick": true,
"minRange": null,
"type": "linear",
"tickmarkPlacement": null,
"labels": {
"enabled": true,
"formatter": null,
"style": {
"color": "#666666",
"cursor": "default",
"fontSize": "11px"
},
"useHTML": false
}
},
"zAxis": {
"title": {
"text": "Multi Score"
}
},
"plotOptions": {
"series": {
"dataLabels": {
"enabled": false,
"format": null,
"distance": 30,
"align": "center",
"inside": null,
"allowOverlap": false,
"style": {
"fontSize": "11px"
}
},
"showInLegend": null,
"turboThreshold": 0,
"stacking": "",
"groupPadding": 0.2,
"centerInCategory": false,
"findNearestPointBy": "x"
}
},
"navigator": {
"enabled": false
},
"scrollbar": {
"enabled": false
},
"rangeSelector": {
"enabled": false,
"inputEnabled": false
},
"legend": {
"enabled": null,
"maxHeight": null,
"align": "center",
"verticalAlign": "bottom",
"layout": "horizontal",
"width": null,
"margin": 12,
"reversed": false
},
"series": [
{
"name": "v2-standard-1 by VEXXHOST",
"color": "#6536FF",
"data": [
{
"x": 551.3795662615437,
"y": 538.4869585506959
},
{
"x": 536.2779797855538,
"y": 504.45121564502256
},
{
"x": 514.8675565601909,
"y": 542.8082004708617
},
{
"x": 544.9834832027108,
"y": 543.5401507372428
},
{
"x": 537.259556880452,
"y": 529.6791247102478
},
{
"x": 525.4731202730159,
"y": 539.6106295432455
},
{
"x": 519.542438521797,
"y": 512.0036444274683
},
{
"x": 541.2030048988458,
"y": 534.7667681601632
},
{
"x": 518.5215053477484,
"y": 519.2660257656245
},
{
"x": 526.869770886457,
"y": 527.7347137079149
},
{
"x": 521.8213395150125,
"y": 521.4527884765963
},
{
"x": 540.7822102460818,
"y": 539.3410646449306
},
{
"x": 524.7221893849456,
"y": 526.156584463239
},
{
"x": 510.7351144519116,
"y": 523.3222402372435
},
{
"x": 532.8666323100308,
"y": 516.7570567579384
},
{
"x": 540.863122298261,
"y": 529.1770745906174
},
{
"x": 514.8560547382951,
"y": 504.8378216605456
},
{
"x": 533.1977602281584,
"y": 544.4384235432726
},
{
"x": 495.3603644695876,
"y": 498.4526753241637
},
{
"x": 538.9031282836501,
"y": 528.5034637229264
},
{
"x": 499.78470601117704,
"y": 491.93145195418856
},
{
"x": 535.2875347256661,
"y": 546.5313484342278
},
{
"x": 503.7744606263211,
"y": 501.04569727660396
},
{
"x": 544.1099328898104,
"y": 539.5598921310934
},
{
"x": 511.9092026405906,
"y": 497.8121717253714
},
{
"x": 594.8915989986757,
"y": 612.5602935886827
},
{
"x": 612.6004151055046,
"y": 610.8499086643475
},
{
"x": 612.239816644131,
"y": 620.1684097423226
},
{
"x": 626.9026926477259,
"y": 613.9387111726761
},
{
"x": 617.3525028345962,
"y": 607.5894059113393
},
{
"x": 607.5208057071382,
"y": 599.7934301782591
},
{
"x": 597.6424406429223,
"y": 599.2572018158776
},
{
"x": 627.4240078617377,
"y": 619.2748568886681
},
{
"x": 611.195146733086,
"y": 615.2072528934414
},
{
"x": 627.5723611974199,
"y": 615.7427666519881
}
]
}
],
"drilldown": {},
"tooltip": {
"enabled": true,
"useHTML": false,
"format": null,
"headerFormat": "",
"pointFormat": "<span style=\"color:{series.color}\">Single</span>: <b>{point.x:.0f}</b><br><span style=\"color:{series.color}\">Multi</span>: <b>{point.y:.0f}</b>",
"footerFormat": "",
"shared": false,
"outside": false,
"valueDecimals": null,
"split": false
},
"annotations": null
},
"hc_type": "chart",
"id": "266849631880369078725542833236606078664"
}
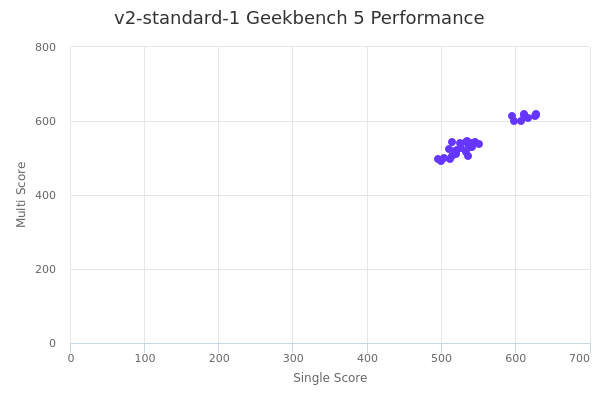
| Single | Multi | |
|---|---|---|
| Max | 628 | 620 |
| Average | 551 | 549 |
| Deviation | 41.64 | 41.98 |
| Min | 495 | 492 |
Sign up as Freemium to get more insight.
- In same series
- v2-standard-1
- v2-standard-2
- v2-standard-4
- v2-standard-8
- v2-standard-16