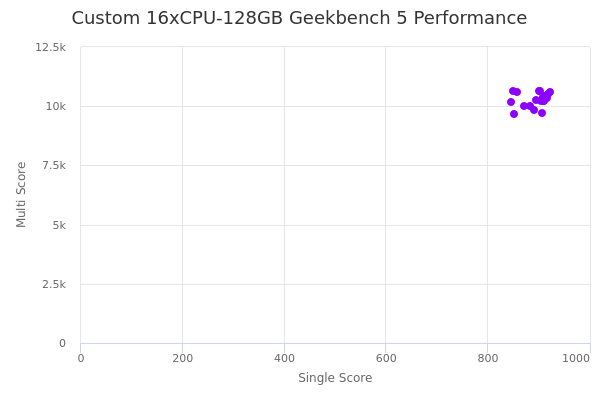
Custom 16xCPU-128GB by UpCloud
Geekbench is a cross-platform processor benchmark with a scoring system that determines single-core and multi-core performance using loads simulating real-world scenarios. Geekbench 5 score is calculated with a reference score of 2500 representing the performance of the Intel Core i5-2520M @ 2.50 GHz. The software benchmark is available for Mac OS, Windows, Linux, Android and iOS platforms.
Specifications:
CPU
16
RAM
128.0 GB
{
"configuration": {
"chart": {
"type": "scatter",
"polar": false,
"zoomType": "",
"options3d": {},
"height": null,
"width": null,
"margin": null,
"inverted": false,
"zooming": {}
},
"credits": {
"enabled": false
},
"title": {
"text": ""
},
"colorAxis": null,
"subtitle": {
"text": ""
},
"xAxis": {
"title": {
"text": [
"Single Score"
],
"useHTML": false,
"style": {
"color": "#666666"
}
},
"categories": null,
"lineWidth": 1,
"tickInterval": null,
"tickWidth": 1,
"tickLength": 10,
"tickPixelInterval": 100,
"plotLines": null,
"labels": {
"enabled": true,
"format": null,
"formatter": "",
"style": {
"color": "#666666",
"cursor": "default",
"fontSize": "11px"
},
"useHTML": false,
"step": 0
},
"plotBands": null,
"visible": true,
"floor": null,
"ceiling": null,
"type": "linear",
"min": 0,
"gridLineWidth": 1,
"gridLineColor": "#e6e6e6",
"minorTickInterval": null,
"minorTickWidth": 0,
"minTickInterval": null,
"startOnTick": true,
"endOnTick": true,
"tickmarkPlacement": 100,
"units": 100,
"minRange": 100
},
"yAxis": {
"title": {
"text": [
"Multi Score"
],
"useHTML": false,
"style": {
"color": "#666666"
}
},
"categories": null,
"plotLines": null,
"plotBands": null,
"lineWidth": null,
"tickInterval": null,
"tickLength": 10,
"floor": null,
"ceiling": null,
"gridLineInterpolation": null,
"gridLineWidth": 1,
"gridLineColor": "#e6e6e6",
"min": 0,
"max": null,
"minorTickInterval": null,
"minorTickWidth": 0,
"minTickInterval": null,
"startOnTick": true,
"endOnTick": true,
"minRange": null,
"type": "linear",
"tickmarkPlacement": null,
"labels": {
"enabled": true,
"formatter": null,
"style": {
"color": "#666666",
"cursor": "default",
"fontSize": "11px"
},
"useHTML": false
}
},
"zAxis": {
"title": {
"text": "Multi Score"
}
},
"plotOptions": {
"series": {
"dataLabels": {
"enabled": false,
"format": null,
"distance": 30,
"align": "center",
"inside": null,
"allowOverlap": false,
"style": {
"fontSize": "11px"
}
},
"showInLegend": null,
"turboThreshold": 0,
"stacking": "",
"groupPadding": 0.2,
"centerInCategory": false,
"findNearestPointBy": "x"
}
},
"navigator": {
"enabled": false
},
"scrollbar": {
"enabled": false
},
"rangeSelector": {
"enabled": false,
"inputEnabled": false
},
"legend": {
"enabled": null,
"maxHeight": null,
"align": "center",
"verticalAlign": "bottom",
"layout": "horizontal",
"width": null,
"margin": 12,
"reversed": false
},
"series": [
{
"name": "Custom 16xCPU-128GB by UpCloud",
"color": "#8b00ff",
"data": [
{
"x": 906.2690003653222,
"y": 9718.638268371646
},
{
"x": 849.80310583638,
"y": 10634.86442725408
},
{
"x": 910.2338629735013,
"y": 10446.285917944368
},
{
"x": 870.65979627855,
"y": 10003.288782162053
},
{
"x": 857.9383369822417,
"y": 10590.852367468291
},
{
"x": 901.1878914159636,
"y": 10623.603127244569
},
{
"x": 917.7559919680666,
"y": 10523.28438739829
},
{
"x": 907.7680038912151,
"y": 10233.252937011315
},
{
"x": 908.5523421445163,
"y": 10313.642993431093
},
{
"x": 891.8205339335616,
"y": 9822.86415957092
},
{
"x": 922.0748358980844,
"y": 10615.22216050032
},
{
"x": 894.7473678869062,
"y": 10255.4992807698
},
{
"x": 883.7668035036963,
"y": 10026.540750296834
},
{
"x": 903.7219720087899,
"y": 10658.82968215242
},
{
"x": 915.8798213799685,
"y": 10361.684470677063
},
{
"x": 904.6293355984715,
"y": 10240.500883540159
},
{
"x": 911.2271578118578,
"y": 10200.943259040603
},
{
"x": 851.224860064653,
"y": 9653.360477807233
},
{
"x": 907.9673953512519,
"y": 10379.871792933105
},
{
"x": 845.0489888086547,
"y": 10184.744672036179
}
]
}
],
"drilldown": {},
"tooltip": {
"enabled": true,
"useHTML": false,
"format": null,
"headerFormat": "",
"pointFormat": "<span style=\"color:{series.color}\">Single</span>: <b>{point.x:.0f}</b><br><span style=\"color:{series.color}\">Multi</span>: <b>{point.y:.0f}</b>",
"footerFormat": "",
"shared": false,
"outside": false,
"valueDecimals": null,
"split": false
},
"annotations": null
},
"hc_type": "chart",
"id": "252659306570024407499615885437100859199"
}
| Single | Multi | |
|---|---|---|
| Max | 922 | 10659 |
| Average | 893 | 10274 |
| Deviation | 24.00 | 298.14 |
| Min | 845 | 9653 |
Sign up as Freemium to get more insight.
- In same series
- Custom 1xCPU-1GB
- Custom 1xCPU-2GB
- Custom 1xCPU-4GB
- Custom 1xCPU-8GB
- Custom 1xCPU-12GB
- Custom 2xCPU-2GB
- Custom 2xCPU-4GB
- Custom 2xCPU-8GB
- Custom 2xCPU-12GB
- Custom 2xCPU-16GB
- Custom 2xCPU-20GB
- Custom 2xCPU-24GB
- Custom 3xCPU-4GB
- Custom 3xCPU-8GB
- Custom 3xCPU-12GB
- Custom 3xCPU-16GB
- Custom 3xCPU-20GB
- Custom 3xCPU-24GB
- Custom 3xCPU-32GB
- Custom 4xCPU-4GB
- Custom 4xCPU-8GB
- Custom 4xCPU-12GB
- Custom 4xCPU-16GB
- Custom 4xCPU-20GB
- Custom 4xCPU-24GB
- Custom 4xCPU-32GB
- Custom 4xCPU-48GB
- Custom 5xCPU-8GB
- Custom 5xCPU-12GB
- Custom 5xCPU-16GB
- Custom 5xCPU-20GB
- Custom 5xCPU-24GB
- Custom 5xCPU-32GB
- Custom 5xCPU-48GB
- Custom 5xCPU-64GB
- Custom 6xCPU-8GB
- Custom 6xCPU-12GB
- Custom 6xCPU-16GB
- Custom 6xCPU-20GB
- Custom 6xCPU-24GB
- Custom 6xCPU-32GB
- Custom 6xCPU-48GB
- Custom 6xCPU-64GB
- Custom 7xCPU-8GB
- Custom 7xCPU-12GB
- Custom 7xCPU-16GB
- Custom 7xCPU-20GB
- Custom 7xCPU-24GB
- Custom 7xCPU-32GB
- Custom 7xCPU-48GB
- Custom 7xCPU-64GB
- Custom 7xCPU-96GB
- Custom 8xCPU-8GB
- Custom 8xCPU-12GB
- Custom 8xCPU-16GB
- Custom 8xCPU-20GB
- Custom 8xCPU-24GB
- Custom 8xCPU-32GB
- Custom 8xCPU-48GB
- Custom 8xCPU-64GB
- Custom 8xCPU-96GB
- Custom 9xCPU-12GB
- Custom 9xCPU-16GB
- Custom 9xCPU-20GB
- Custom 9xCPU-24GB
- Custom 9xCPU-32GB
- Custom 9xCPU-48GB
- Custom 9xCPU-64GB
- Custom 9xCPU-96GB
- Custom 9xCPU-128GB
- Custom 10xCPU-12GB
- Custom 10xCPU-16GB
- Custom 10xCPU-20GB
- Custom 10xCPU-24GB
- Custom 10xCPU-32GB
- Custom 10xCPU-48GB
- Custom 10xCPU-64GB
- Custom 10xCPU-96GB
- Custom 10xCPU-128GB
- Custom 11xCPU-12GB
- Custom 11xCPU-16GB
- Custom 11xCPU-20GB
- Custom 11xCPU-24GB
- Custom 11xCPU-32GB
- Custom 11xCPU-48GB
- Custom 11xCPU-64GB
- Custom 11xCPU-96GB
- Custom 11xCPU-128GB
- Custom 12xCPU-12GB
- Custom 12xCPU-16GB
- Custom 12xCPU-20GB
- Custom 12xCPU-24GB
- Custom 12xCPU-32GB
- Custom 12xCPU-48GB
- Custom 12xCPU-64GB
- Custom 12xCPU-96GB
- Custom 12xCPU-128GB
- Custom 13xCPU-16GB
- Custom 13xCPU-20GB
- Custom 13xCPU-24GB
- Custom 13xCPU-32GB
- Custom 13xCPU-48GB
- Custom 13xCPU-64GB
- Custom 13xCPU-96GB
- Custom 13xCPU-128GB
- Custom 14xCPU-16GB
- Custom 14xCPU-20GB
- Custom 14xCPU-24GB
- Custom 14xCPU-32GB
- Custom 14xCPU-48GB
- Custom 14xCPU-64GB
- Custom 14xCPU-96GB
- Custom 14xCPU-128GB
- Custom 15xCPU-16GB
- Custom 15xCPU-20GB
- Custom 15xCPU-24GB
- Custom 15xCPU-32GB
- Custom 15xCPU-48GB
- Custom 15xCPU-64GB
- Custom 15xCPU-96GB
- Custom 15xCPU-128GB
- Custom 16xCPU-16GB
- Custom 16xCPU-20GB
- Custom 16xCPU-24GB
- Custom 16xCPU-32GB
- Custom 16xCPU-48GB
- Custom 16xCPU-64GB
- Custom 16xCPU-96GB
- Custom 16xCPU-128GB
- Custom 17xCPU-20GB
- Custom 17xCPU-24GB
- Custom 17xCPU-32GB
- Custom 17xCPU-48GB
- Custom 17xCPU-64GB
- Custom 17xCPU-96GB
- Custom 17xCPU-128GB
- Custom 18xCPU-20GB
- Custom 18xCPU-24GB
- Custom 18xCPU-32GB
- Custom 18xCPU-48GB
- Custom 18xCPU-64GB
- Custom 18xCPU-96GB
- Custom 18xCPU-128GB
- Custom 19xCPU-20GB
- Custom 19xCPU-24GB
- Custom 19xCPU-32GB
- Custom 19xCPU-48GB
- Custom 19xCPU-64GB
- Custom 19xCPU-96GB
- Custom 19xCPU-128GB
- Custom 20xCPU-20GB
- Custom 20xCPU-24GB
- Custom 20xCPU-32GB
- Custom 20xCPU-48GB
- Custom 20xCPU-64GB
- Custom 20xCPU-96GB
- Custom 20xCPU-128GB