physical.o2.medium by T-Systems Open Telekom Cloud
Geekbench is a cross-platform processor benchmark with a scoring system that determines single-core and multi-core performance using loads simulating real-world scenarios. Geekbench 5 score is calculated with a reference score of 2500 representing the performance of the Intel Core i5-2520M @ 2.50 GHz. The software benchmark is available for Mac OS, Windows, Linux, Android and iOS platforms.
Specifications:
CPU
32
RAM
256.0 GB
{
"configuration": {
"chart": {
"type": "scatter",
"polar": false,
"zoomType": "",
"options3d": {},
"height": null,
"width": null,
"margin": null,
"inverted": false,
"zooming": {}
},
"credits": {
"enabled": false
},
"title": {
"text": ""
},
"colorAxis": null,
"subtitle": {
"text": ""
},
"xAxis": {
"title": {
"text": [
"Single Score"
],
"useHTML": false,
"style": {
"color": "#666666"
}
},
"categories": null,
"lineWidth": 1,
"tickInterval": null,
"tickWidth": 1,
"tickLength": 10,
"tickPixelInterval": 100,
"plotLines": null,
"labels": {
"enabled": true,
"format": null,
"formatter": "",
"style": {
"color": "#666666",
"cursor": "default",
"fontSize": "11px"
},
"useHTML": false,
"step": 0
},
"plotBands": null,
"visible": true,
"floor": null,
"ceiling": null,
"type": "linear",
"min": 0,
"gridLineWidth": 1,
"gridLineColor": "#e6e6e6",
"minorTickInterval": null,
"minorTickWidth": 0,
"minTickInterval": null,
"startOnTick": true,
"endOnTick": true,
"tickmarkPlacement": 100,
"units": 100,
"minRange": 100
},
"yAxis": {
"title": {
"text": [
"Multi Score"
],
"useHTML": false,
"style": {
"color": "#666666"
}
},
"categories": null,
"plotLines": null,
"plotBands": null,
"lineWidth": null,
"tickInterval": null,
"tickLength": 10,
"floor": null,
"ceiling": null,
"gridLineInterpolation": null,
"gridLineWidth": 1,
"gridLineColor": "#e6e6e6",
"min": 0,
"max": null,
"minorTickInterval": null,
"minorTickWidth": 0,
"minTickInterval": null,
"startOnTick": true,
"endOnTick": true,
"minRange": null,
"type": "linear",
"tickmarkPlacement": null,
"labels": {
"enabled": true,
"formatter": null,
"style": {
"color": "#666666",
"cursor": "default",
"fontSize": "11px"
},
"useHTML": false
}
},
"zAxis": {
"title": {
"text": "Multi Score"
}
},
"plotOptions": {
"series": {
"dataLabels": {
"enabled": false,
"format": null,
"distance": 30,
"align": "center",
"inside": null,
"allowOverlap": false,
"style": {
"fontSize": "11px"
}
},
"showInLegend": null,
"turboThreshold": 0,
"stacking": "",
"groupPadding": 0.2,
"centerInCategory": false,
"findNearestPointBy": "x"
}
},
"navigator": {
"enabled": false
},
"scrollbar": {
"enabled": false
},
"rangeSelector": {
"enabled": false,
"inputEnabled": false
},
"legend": {
"enabled": null,
"maxHeight": null,
"align": "center",
"verticalAlign": "bottom",
"layout": "horizontal",
"width": null,
"margin": 12,
"reversed": false
},
"series": [
{
"name": "physical.o2.medium by T-Systems Open Telekom Cloud",
"color": "#d1006c",
"data": [
{
"x": 971.3996538716922,
"y": 13895.618509362717
},
{
"x": 971.8201316206151,
"y": 13747.644988566295
},
{
"x": 970.9573635841136,
"y": 13835.431544486848
},
{
"x": 970.7452556687354,
"y": 13721.719444224393
},
{
"x": 968.798999422786,
"y": 13816.848162962198
},
{
"x": 971.2432570124706,
"y": 13533.518529545207
},
{
"x": 967.4687175834117,
"y": 13688.778404197199
},
{
"x": 969.993219321391,
"y": 13735.56663123081
},
{
"x": 970.7312904076945,
"y": 13985.993427574367
},
{
"x": 971.8796397088706,
"y": 13396.592324561372
},
{
"x": 966.144510839285,
"y": 13516.622594024306
},
{
"x": 969.9516510005159,
"y": 13603.317570867817
},
{
"x": 972.7885828256683,
"y": 14069.259623602766
},
{
"x": 968.6952733970286,
"y": 13888.153259286628
},
{
"x": 970.7390565942922,
"y": 13899.208476877986
},
{
"x": 968.6514841464696,
"y": 13515.740285617936
},
{
"x": 966.27519567112,
"y": 13673.265005675032
},
{
"x": 973.3945825291555,
"y": 13774.74372981249
},
{
"x": 967.2996965882621,
"y": 13996.30925537253
},
{
"x": 966.7459150012039,
"y": 13883.381117681321
}
]
}
],
"drilldown": {},
"tooltip": {
"enabled": true,
"useHTML": false,
"format": null,
"headerFormat": "",
"pointFormat": "<span style=\"color:{series.color}\">Single</span>: <b>{point.x:.0f}</b><br><span style=\"color:{series.color}\">Multi</span>: <b>{point.y:.0f}</b>",
"footerFormat": "",
"shared": false,
"outside": false,
"valueDecimals": null,
"split": false
},
"annotations": null
},
"hc_type": "chart",
"id": "132452727754642685019842463278038991737"
}
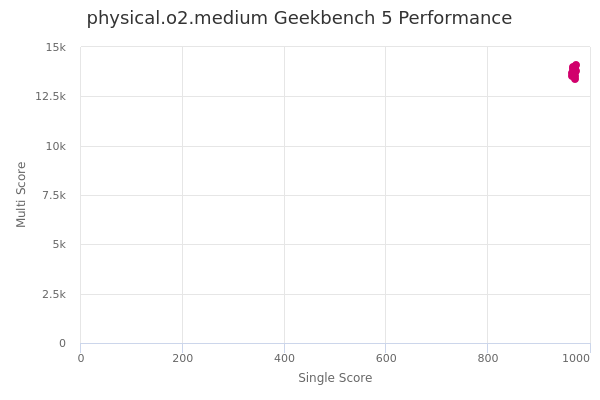
| Single | Multi | |
|---|---|---|
| Max | 973 | 14069 |
| Average | 970 | 13759 |
| Deviation | 2.11 | 176.45 |
| Min | 966 | 13397 |
Sign up as Freemium to get more insight.
- In same series
- physical.o2.medium