h2.3xlarge.10 by T-Systems Open Telekom Cloud
Geekbench is a cross-platform processor benchmark with a scoring system that determines single-core and multi-core performance using loads simulating real-world scenarios. Geekbench 5 score is calculated with a reference score of 2500 representing the performance of the Intel Core i5-2520M @ 2.50 GHz. The software benchmark is available for Mac OS, Windows, Linux, Android and iOS platforms.
Specifications:
CPU
16
RAM
128.0 GB
{
"configuration": {
"chart": {
"type": "scatter",
"polar": false,
"zoomType": "",
"options3d": {},
"height": null,
"width": null,
"margin": null,
"inverted": false,
"zooming": {}
},
"credits": {
"enabled": false
},
"title": {
"text": ""
},
"colorAxis": null,
"subtitle": {
"text": ""
},
"xAxis": {
"title": {
"text": [
"Single Score"
],
"useHTML": false,
"style": {
"color": "#666666"
}
},
"categories": null,
"lineWidth": 1,
"tickInterval": null,
"tickWidth": 1,
"tickLength": 10,
"tickPixelInterval": 100,
"plotLines": null,
"labels": {
"enabled": true,
"format": null,
"formatter": "",
"style": {
"color": "#666666",
"cursor": "default",
"fontSize": "11px"
},
"useHTML": false,
"step": 0
},
"plotBands": null,
"visible": true,
"floor": null,
"ceiling": null,
"type": "linear",
"min": 0,
"gridLineWidth": 1,
"gridLineColor": "#e6e6e6",
"minorTickInterval": null,
"minorTickWidth": 0,
"minTickInterval": null,
"startOnTick": true,
"endOnTick": true,
"tickmarkPlacement": 100,
"units": 100,
"minRange": 100
},
"yAxis": {
"title": {
"text": [
"Multi Score"
],
"useHTML": false,
"style": {
"color": "#666666"
}
},
"categories": null,
"plotLines": null,
"plotBands": null,
"lineWidth": null,
"tickInterval": null,
"tickLength": 10,
"floor": null,
"ceiling": null,
"gridLineInterpolation": null,
"gridLineWidth": 1,
"gridLineColor": "#e6e6e6",
"min": 0,
"max": null,
"minorTickInterval": null,
"minorTickWidth": 0,
"minTickInterval": null,
"startOnTick": true,
"endOnTick": true,
"minRange": null,
"type": "linear",
"tickmarkPlacement": null,
"labels": {
"enabled": true,
"formatter": null,
"style": {
"color": "#666666",
"cursor": "default",
"fontSize": "11px"
},
"useHTML": false
}
},
"zAxis": {
"title": {
"text": "Multi Score"
}
},
"plotOptions": {
"series": {
"dataLabels": {
"enabled": false,
"format": null,
"distance": 30,
"align": "center",
"inside": null,
"allowOverlap": false,
"style": {
"fontSize": "11px"
}
},
"showInLegend": null,
"turboThreshold": 0,
"stacking": "",
"groupPadding": 0.2,
"centerInCategory": false,
"findNearestPointBy": "x"
}
},
"navigator": {
"enabled": false
},
"scrollbar": {
"enabled": false
},
"rangeSelector": {
"enabled": false,
"inputEnabled": false
},
"legend": {
"enabled": null,
"maxHeight": null,
"align": "center",
"verticalAlign": "bottom",
"layout": "horizontal",
"width": null,
"margin": 12,
"reversed": false
},
"series": [
{
"name": "h2.3xlarge.10 by T-Systems Open Telekom Cloud",
"color": "#d1006c",
"data": [
{
"x": 916.9877674328187,
"y": 11124.56093383447
},
{
"x": 908.8383078606342,
"y": 10854.121916323058
},
{
"x": 913.2743691494595,
"y": 10894.127087940911
},
{
"x": 913.5403705600262,
"y": 10826.403407588648
},
{
"x": 908.108490856169,
"y": 10927.898880139639
},
{
"x": 912.6761891707117,
"y": 10615.2835155158
},
{
"x": 905.9952490516046,
"y": 10898.002229400121
},
{
"x": 904.3258051801206,
"y": 11164.340131212864
},
{
"x": 911.2648658966093,
"y": 10710.194483543715
},
{
"x": 909.1025514722885,
"y": 10851.327468013315
},
{
"x": 909.5422196570878,
"y": 10703.1963392064
},
{
"x": 911.6189332635092,
"y": 11185.052863404862
},
{
"x": 906.6967098671344,
"y": 11095.013366939249
},
{
"x": 910.6433833946587,
"y": 10988.80489591939
},
{
"x": 911.1535568387437,
"y": 11161.841325201589
},
{
"x": 908.2574346179147,
"y": 11011.242744313502
},
{
"x": 909.3628202814634,
"y": 11061.887918668654
},
{
"x": 910.0033494841309,
"y": 11315.705063068457
},
{
"x": 911.148727998615,
"y": 10732.971384271888
},
{
"x": 912.3668910930924,
"y": 11030.306037539844
},
{
"x": 909.9279071946341,
"y": 10878.907793447146
},
{
"x": 906.866291094177,
"y": 10938.336936815995
},
{
"x": 909.1473034135001,
"y": 10769.34358253327
},
{
"x": 910.0444909209194,
"y": 11058.256615643264
},
{
"x": 910.254356785379,
"y": 11153.048167405967
},
{
"x": 907.9815730714126,
"y": 10803.53935858467
},
{
"x": 907.2898649149818,
"y": 10904.682705663938
},
{
"x": 911.7105393959632,
"y": 10735.748868799088
},
{
"x": 904.9985203962312,
"y": 10811.556600271
},
{
"x": 955.2635470473348,
"y": 10850.032570058262
},
{
"x": 941.8581205409307,
"y": 10803.819155500682
},
{
"x": 950.9773655071706,
"y": 11052.420651564544
},
{
"x": 943.2881332376078,
"y": 10542.754473682466
},
{
"x": 938.5779326243762,
"y": 11165.598912578573
},
{
"x": 950.0827204171524,
"y": 10902.130999380102
},
{
"x": 923.6398701651335,
"y": 10876.868796697037
},
{
"x": 949.7939561383298,
"y": 11011.797802385652
},
{
"x": 940.1009321360909,
"y": 11146.385237964325
},
{
"x": 941.8083320108506,
"y": 11002.784189027863
},
{
"x": 943.3951096500782,
"y": 10592.991389442665
},
{
"x": 952.1168449335637,
"y": 10652.405931746627
},
{
"x": 943.6307702125432,
"y": 10846.908874233797
},
{
"x": 950.4435290729605,
"y": 10861.59792959043
},
{
"x": 937.6081383129292,
"y": 10900.772977520763
},
{
"x": 951.6041485894896,
"y": 10476.582666683455
},
{
"x": 937.2962631353862,
"y": 11000.55068325661
},
{
"x": 948.488376214531,
"y": 10856.043843101907
},
{
"x": 948.058980008603,
"y": 11151.57713131638
},
{
"x": 938.5914742284921,
"y": 10907.030511986324
},
{
"x": 954.3240674224273,
"y": 11025.067624695323
},
{
"x": 947.397928748588,
"y": 10890.056880311673
},
{
"x": 947.1106882184222,
"y": 10949.514215140978
},
{
"x": 942.7933180703751,
"y": 11142.652999256528
},
{
"x": 948.033281338747,
"y": 10630.926951763147
},
{
"x": 936.8994848262244,
"y": 10699.31273153968
},
{
"x": 952.4543357534319,
"y": 11105.603909697593
},
{
"x": 951.390890691893,
"y": 11137.518792076698
},
{
"x": 940.4178215020667,
"y": 11127.269078338728
},
{
"x": 948.5562088905494,
"y": 10958.022059260891
},
{
"x": 950.5992798677851,
"y": 10910.607812009861
},
{
"x": 943.2937829846837,
"y": 10964.665061393202
},
{
"x": 950.1145324775656,
"y": 10806.123652718252
},
{
"x": 949.1133381974151,
"y": 10847.687748861994
},
{
"x": 949.3598318466815,
"y": 10967.3387589645
},
{
"x": 947.4110743567297,
"y": 10351.58546540958
},
{
"x": 949.8937219111883,
"y": 10656.0046226981
},
{
"x": 944.0052008078558,
"y": 10680.198870057493
},
{
"x": 941.8903999113022,
"y": 10437.519279102631
},
{
"x": 948.2241664806015,
"y": 10394.664484963228
}
]
}
],
"drilldown": {},
"tooltip": {
"enabled": true,
"useHTML": false,
"format": null,
"headerFormat": "",
"pointFormat": "<span style=\"color:{series.color}\">Single</span>: <b>{point.x:.0f}</b><br><span style=\"color:{series.color}\">Multi</span>: <b>{point.y:.0f}</b>",
"footerFormat": "",
"shared": false,
"outside": false,
"valueDecimals": null,
"split": false
},
"annotations": null
},
"hc_type": "chart",
"id": "92885047857688061485529664836309362242"
}
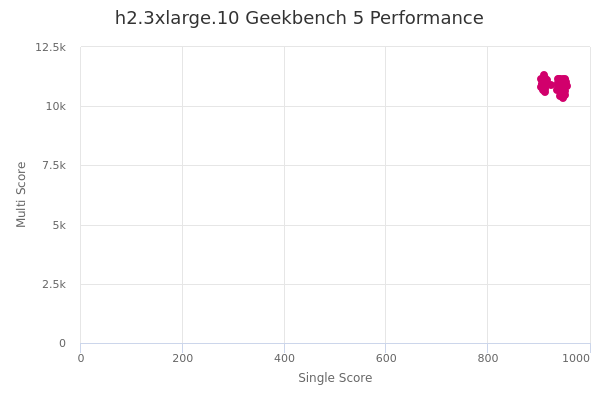
| Single | Multi | |
|---|---|---|
| Max | 955 | 11316 |
| Average | 931 | 10891 |
| Deviation | 18.43 | 203.57 |
| Min | 904 | 10352 |
Sign up as Freemium to get more insight.
- In same series
- h2.3xlarge.10
- h2.3xlarge.20