I1-90 by OVHcloud
Geekbench is a cross-platform processor benchmark with a scoring system that determines single-core and multi-core performance using loads simulating real-world scenarios. Geekbench 5 score is calculated with a reference score of 2500 representing the performance of the Intel Core i5-2520M @ 2.50 GHz. The software benchmark is available for Mac OS, Windows, Linux, Android and iOS platforms.
Specifications:
CPU
16
RAM
87.9 GB
Root
50 GB
Root local SSD
Extra
2x
1800 GB
NVMe SSD
{
"configuration": {
"chart": {
"type": "scatter",
"polar": false,
"zoomType": "",
"options3d": {},
"height": null,
"width": null,
"margin": null,
"inverted": false,
"zooming": {}
},
"credits": {
"enabled": false
},
"title": {
"text": ""
},
"colorAxis": null,
"subtitle": {
"text": ""
},
"xAxis": {
"title": {
"text": [
"Single Score"
],
"useHTML": false,
"style": {
"color": "#666666"
}
},
"categories": null,
"lineWidth": 1,
"tickInterval": null,
"tickWidth": 1,
"tickLength": 10,
"tickPixelInterval": 100,
"plotLines": null,
"labels": {
"enabled": true,
"format": null,
"formatter": "",
"style": {
"color": "#666666",
"cursor": "default",
"fontSize": "11px"
},
"useHTML": false,
"step": 0
},
"plotBands": null,
"visible": true,
"floor": null,
"ceiling": null,
"type": "linear",
"min": 0,
"gridLineWidth": 1,
"gridLineColor": "#e6e6e6",
"minorTickInterval": null,
"minorTickWidth": 0,
"minTickInterval": null,
"startOnTick": true,
"endOnTick": true,
"tickmarkPlacement": 100,
"units": 100,
"minRange": 100
},
"yAxis": {
"title": {
"text": [
"Multi Score"
],
"useHTML": false,
"style": {
"color": "#666666"
}
},
"categories": null,
"plotLines": null,
"plotBands": null,
"lineWidth": null,
"tickInterval": null,
"tickLength": 10,
"floor": null,
"ceiling": null,
"gridLineInterpolation": null,
"gridLineWidth": 1,
"gridLineColor": "#e6e6e6",
"min": 0,
"max": null,
"minorTickInterval": null,
"minorTickWidth": 0,
"minTickInterval": null,
"startOnTick": true,
"endOnTick": true,
"minRange": null,
"type": "linear",
"tickmarkPlacement": null,
"labels": {
"enabled": true,
"formatter": null,
"style": {
"color": "#666666",
"cursor": "default",
"fontSize": "11px"
},
"useHTML": false
}
},
"zAxis": {
"title": {
"text": "Multi Score"
}
},
"plotOptions": {
"series": {
"dataLabels": {
"enabled": false,
"format": null,
"distance": 30,
"align": "center",
"inside": null,
"allowOverlap": false,
"style": {
"fontSize": "11px"
}
},
"showInLegend": null,
"turboThreshold": 0,
"stacking": "",
"groupPadding": 0.2,
"centerInCategory": false,
"findNearestPointBy": "x"
}
},
"navigator": {
"enabled": false
},
"scrollbar": {
"enabled": false
},
"rangeSelector": {
"enabled": false,
"inputEnabled": false
},
"legend": {
"enabled": null,
"maxHeight": null,
"align": "center",
"verticalAlign": "bottom",
"layout": "horizontal",
"width": null,
"margin": 12,
"reversed": false
},
"series": [
{
"name": "I1-90 by OVHcloud",
"color": "#484848",
"data": [
{
"x": 740.5524837996114,
"y": 9119.178487236106
},
{
"x": 718.237068526329,
"y": 9121.32290492284
},
{
"x": 722.7386684589513,
"y": 8931.948334090359
},
{
"x": 735.5087425183002,
"y": 8691.152206857654
},
{
"x": 735.0973237031199,
"y": 8885.873672049664
},
{
"x": 719.5963465466925,
"y": 8623.842348989805
},
{
"x": 716.6560576173464,
"y": 8909.067697605882
},
{
"x": 748.3590304513609,
"y": 8852.001285717099
},
{
"x": 718.2582393853065,
"y": 8619.03486614969
},
{
"x": 727.4017599463265,
"y": 8547.93267498685
},
{
"x": 725.3517752680903,
"y": 8823.728795660836
},
{
"x": 706.2543748497751,
"y": 8209.715140063074
},
{
"x": 732.5040895833985,
"y": 8859.345986043014
},
{
"x": 730.8971093150759,
"y": 8788.793085776213
},
{
"x": 708.1185864253142,
"y": 8858.088781351773
},
{
"x": 727.357349892399,
"y": 8753.735780054914
},
{
"x": 714.4071572055144,
"y": 8921.093452083072
},
{
"x": 725.2549763373498,
"y": 8815.222790449401
},
{
"x": 708.51372899361,
"y": 8749.880778658957
},
{
"x": 719.0377494897251,
"y": 8614.41882050239
},
{
"x": 745.1094697202011,
"y": 8979.585556547921
},
{
"x": 735.5614628005175,
"y": 8874.773987383502
},
{
"x": 744.0640172138262,
"y": 8972.099625492972
},
{
"x": 721.9348260852807,
"y": 9064.630088244261
},
{
"x": 749.4761296973572,
"y": 8873.767537757636
},
{
"x": 702.6323196828253,
"y": 7599.358466343372
},
{
"x": 702.8735807134566,
"y": 7718.59919280146
},
{
"x": 700.0313378837695,
"y": 7908.725237384797
},
{
"x": 703.4239778181473,
"y": 7723.553728762461
},
{
"x": 704.8102789709001,
"y": 7303.298105877192
},
{
"x": 696.1209610045212,
"y": 7447.269875954532
},
{
"x": 694.0935681249106,
"y": 7608.107217399578
},
{
"x": 691.569790641706,
"y": 7706.222537660039
},
{
"x": 700.0404065461589,
"y": 7420.881014317902
},
{
"x": 695.0333398713949,
"y": 7508.823997103658
},
{
"x": 698.834520474092,
"y": 7850.04493813877
},
{
"x": 699.5028336170814,
"y": 7912.945370446203
},
{
"x": 698.5303993111052,
"y": 7786.784371592225
},
{
"x": 700.0152330502947,
"y": 8101.235401770782
},
{
"x": 699.2836053003556,
"y": 7609.2716285845745
},
{
"x": 693.2967098830833,
"y": 7847.101669508675
},
{
"x": 699.5534906806784,
"y": 8062.623604792825
},
{
"x": 683.0789975698735,
"y": 8108.684518966444
},
{
"x": 687.010888754904,
"y": 7713.140549270856
},
{
"x": 690.2409733943002,
"y": 8013.456254408622
},
{
"x": 684.9854934560573,
"y": 8018.103714187138
}
]
}
],
"drilldown": {},
"tooltip": {
"enabled": true,
"useHTML": false,
"format": null,
"headerFormat": "",
"pointFormat": "<span style=\"color:{series.color}\">Single</span>: <b>{point.x:.0f}</b><br><span style=\"color:{series.color}\">Multi</span>: <b>{point.y:.0f}</b>",
"footerFormat": "",
"shared": false,
"outside": false,
"valueDecimals": null,
"split": false
},
"annotations": null
},
"hc_type": "chart",
"id": "155374102649608274442435881252805026888"
}
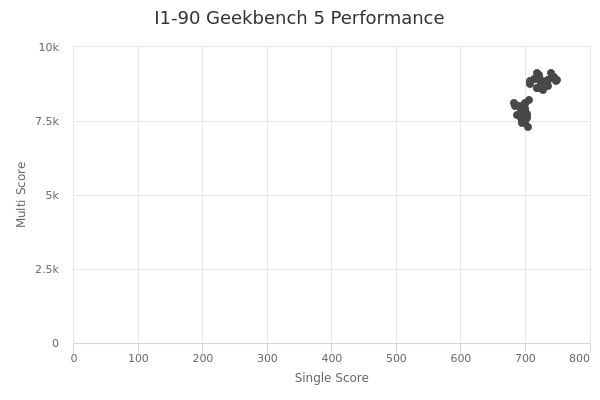
| Single | Multi | |
|---|---|---|
| Max | 749 | 9121 |
| Average | 713 | 8335 |
| Deviation | 18.17 | 567.04 |
| Min | 683 | 7303 |