B3-32 by OVHcloud
Geekbench is a cross-platform processor benchmark with a scoring system that determines single-core and multi-core performance using loads simulating real-world scenarios. Geekbench 5 score is calculated with a reference score of 2500 representing the performance of the Intel Core i5-2520M @ 2.50 GHz. The software benchmark is available for Mac OS, Windows, Linux, Android and iOS platforms.
Specifications:
CPU
8
RAM
31.2 GB
Root
200 GB
Root local SSD
{
"configuration": {
"chart": {
"type": "scatter",
"polar": false,
"zoomType": "",
"options3d": {},
"height": null,
"width": null,
"margin": null,
"inverted": false,
"zooming": {}
},
"credits": {
"enabled": false
},
"title": {
"text": ""
},
"colorAxis": null,
"subtitle": {
"text": ""
},
"xAxis": {
"title": {
"text": [
"Single Score"
],
"useHTML": false,
"style": {
"color": "#666666"
}
},
"categories": null,
"lineWidth": 1,
"tickInterval": null,
"tickWidth": 1,
"tickLength": 10,
"tickPixelInterval": 100,
"plotLines": null,
"labels": {
"enabled": true,
"format": null,
"formatter": "",
"style": {
"color": "#666666",
"cursor": "default",
"fontSize": "11px"
},
"useHTML": false,
"step": 0
},
"plotBands": null,
"visible": true,
"floor": null,
"ceiling": null,
"type": "linear",
"min": 0,
"gridLineWidth": 1,
"gridLineColor": "#e6e6e6",
"minorTickInterval": null,
"minorTickWidth": 0,
"minTickInterval": null,
"startOnTick": true,
"endOnTick": true,
"tickmarkPlacement": 100,
"units": 100,
"minRange": 100
},
"yAxis": {
"title": {
"text": [
"Multi Score"
],
"useHTML": false,
"style": {
"color": "#666666"
}
},
"categories": null,
"plotLines": null,
"plotBands": null,
"lineWidth": null,
"tickInterval": null,
"tickLength": 10,
"floor": null,
"ceiling": null,
"gridLineInterpolation": null,
"gridLineWidth": 1,
"gridLineColor": "#e6e6e6",
"min": 0,
"max": null,
"minorTickInterval": null,
"minorTickWidth": 0,
"minTickInterval": null,
"startOnTick": true,
"endOnTick": true,
"minRange": null,
"type": "linear",
"tickmarkPlacement": null,
"labels": {
"enabled": true,
"formatter": null,
"style": {
"color": "#666666",
"cursor": "default",
"fontSize": "11px"
},
"useHTML": false
}
},
"zAxis": {
"title": {
"text": "Multi Score"
}
},
"plotOptions": {
"series": {
"dataLabels": {
"enabled": false,
"format": null,
"distance": 30,
"align": "center",
"inside": null,
"allowOverlap": false,
"style": {
"fontSize": "11px"
}
},
"showInLegend": null,
"turboThreshold": 0,
"stacking": "",
"groupPadding": 0.2,
"centerInCategory": false,
"findNearestPointBy": "x"
}
},
"navigator": {
"enabled": false
},
"scrollbar": {
"enabled": false
},
"rangeSelector": {
"enabled": false,
"inputEnabled": false
},
"legend": {
"enabled": null,
"maxHeight": null,
"align": "center",
"verticalAlign": "bottom",
"layout": "horizontal",
"width": null,
"margin": 12,
"reversed": false
},
"series": [
{
"name": "B3-32 by OVHcloud",
"color": "#484848",
"data": [
{
"x": 1229.2147143112968,
"y": 8335.387944731776
},
{
"x": 1197.104925169075,
"y": 8254.670834799577
},
{
"x": 1215.9765128189904,
"y": 8340.777377229937
},
{
"x": 1174.3052918643978,
"y": 8349.5619865886
},
{
"x": 1217.2804381641988,
"y": 8392.195311924008
},
{
"x": 1186.3479889525534,
"y": 8375.722482612966
},
{
"x": 1206.4119890469115,
"y": 8467.058890873954
},
{
"x": 1141.8651419200173,
"y": 7816.490817468688
},
{
"x": 1207.1885950827786,
"y": 8543.532540327386
},
{
"x": 1143.9922878933337,
"y": 7863.930587207817
},
{
"x": 1196.8857369337102,
"y": 8862.744779224638
},
{
"x": 1149.3608493806753,
"y": 8026.306605792788
},
{
"x": 1133.956350453086,
"y": 7846.706404748855
},
{
"x": 1151.127281848579,
"y": 7490.148167934336
},
{
"x": 1140.3015875404078,
"y": 7883.06456041525
},
{
"x": 1140.8690548510228,
"y": 7513.355105556367
},
{
"x": 1138.192495476374,
"y": 7450.683945711841
},
{
"x": 1147.1007754739485,
"y": 7310.391707529703
},
{
"x": 1367.698549374924,
"y": 9385.449320277026
},
{
"x": 1348.6678172910424,
"y": 9100.619651010256
},
{
"x": 1367.9461963174713,
"y": 9284.307746911847
},
{
"x": 1356.2614022910195,
"y": 9366.873959111788
},
{
"x": 1349.3281796591957,
"y": 9350.596045136343
},
{
"x": 1343.063313219094,
"y": 9188.672187073833
},
{
"x": 1314.5425962084566,
"y": 9152.583747008826
},
{
"x": 1291.0408837385596,
"y": 8976.219119436792
},
{
"x": 1299.176651868484,
"y": 9094.138996592672
},
{
"x": 1269.6744432936755,
"y": 8566.71483540367
},
{
"x": 1306.9098958246398,
"y": 8634.81607017551
},
{
"x": 1291.3807359456853,
"y": 8552.669212219815
}
]
}
],
"drilldown": {},
"tooltip": {
"enabled": true,
"useHTML": false,
"format": null,
"headerFormat": "",
"pointFormat": "<span style=\"color:{series.color}\">Single</span>: <b>{point.x:.0f}</b><br><span style=\"color:{series.color}\">Multi</span>: <b>{point.y:.0f}</b>",
"footerFormat": "",
"shared": false,
"outside": false,
"valueDecimals": null,
"split": false
},
"annotations": null
},
"hc_type": "chart",
"id": "243184366551578548342219315276880116696"
}
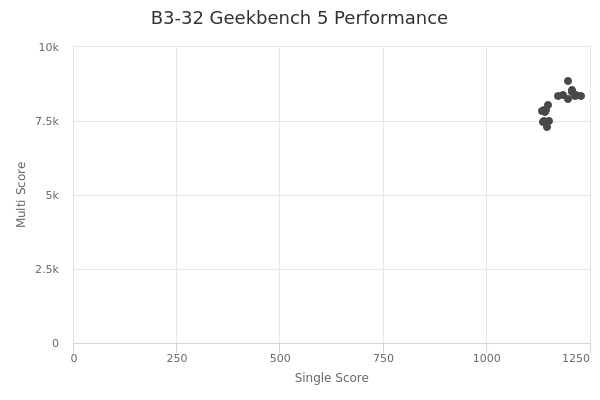
| Single | Multi | |
|---|---|---|
| Max | 1368 | 9385 |
| Average | 1234 | 8459 |
| Deviation | 81.34 | 616.45 |
| Min | 1134 | 7310 |
Sign up as Freemium to get more insight.
- In same series
- B3-8
- B3-8-FLEX
- B3-16
- B3-16-FLEX
- B3-32
- B3-32-FLEX
- B3-64
- B3-64-FLEX
- B3-128
- B3-128-FLEX
- B3-256
- B3-256-FLEX