s3v.large.2 by Orange Business
Geekbench is a cross-platform processor benchmark with a scoring system that determines single-core and multi-core performance using loads simulating real-world scenarios. Geekbench 5 score is calculated with a reference score of 2500 representing the performance of the Intel Core i5-2520M @ 2.50 GHz. The software benchmark is available for Mac OS, Windows, Linux, Android and iOS platforms.
Specifications:
CPU
2
RAM
4.0 GB
{
"configuration": {
"chart": {
"type": "scatter",
"polar": false,
"zoomType": "",
"options3d": {},
"height": null,
"width": null,
"margin": null,
"inverted": false,
"zooming": {}
},
"credits": {
"enabled": false
},
"title": {
"text": ""
},
"colorAxis": null,
"subtitle": {
"text": ""
},
"xAxis": {
"title": {
"text": [
"Single Score"
],
"useHTML": false,
"style": {
"color": "#666666"
}
},
"categories": null,
"lineWidth": 1,
"tickInterval": null,
"tickWidth": 1,
"tickLength": 10,
"tickPixelInterval": 100,
"plotLines": null,
"labels": {
"enabled": true,
"format": null,
"formatter": "",
"style": {
"color": "#666666",
"cursor": "default",
"fontSize": "11px"
},
"useHTML": false,
"step": 0
},
"plotBands": null,
"visible": true,
"floor": null,
"ceiling": null,
"type": "linear",
"min": 0,
"gridLineWidth": 1,
"gridLineColor": "#e6e6e6",
"minorTickInterval": null,
"minorTickWidth": 0,
"minTickInterval": null,
"startOnTick": true,
"endOnTick": true,
"tickmarkPlacement": 100,
"units": 100,
"minRange": 100
},
"yAxis": {
"title": {
"text": [
"Multi Score"
],
"useHTML": false,
"style": {
"color": "#666666"
}
},
"categories": null,
"plotLines": null,
"plotBands": null,
"lineWidth": null,
"tickInterval": null,
"tickLength": 10,
"floor": null,
"ceiling": null,
"gridLineInterpolation": null,
"gridLineWidth": 1,
"gridLineColor": "#e6e6e6",
"min": 0,
"max": null,
"minorTickInterval": null,
"minorTickWidth": 0,
"minTickInterval": null,
"startOnTick": true,
"endOnTick": true,
"minRange": null,
"type": "linear",
"tickmarkPlacement": null,
"labels": {
"enabled": true,
"formatter": null,
"style": {
"color": "#666666",
"cursor": "default",
"fontSize": "11px"
},
"useHTML": false
}
},
"zAxis": {
"title": {
"text": "Multi Score"
}
},
"plotOptions": {
"series": {
"dataLabels": {
"enabled": false,
"format": null,
"distance": 30,
"align": "center",
"inside": null,
"allowOverlap": false,
"style": {
"fontSize": "11px"
}
},
"showInLegend": null,
"turboThreshold": 0,
"stacking": "",
"groupPadding": 0.2,
"centerInCategory": false,
"findNearestPointBy": "x"
}
},
"navigator": {
"enabled": false
},
"scrollbar": {
"enabled": false
},
"rangeSelector": {
"enabled": false,
"inputEnabled": false
},
"legend": {
"enabled": null,
"maxHeight": null,
"align": "center",
"verticalAlign": "bottom",
"layout": "horizontal",
"width": null,
"margin": 12,
"reversed": false
},
"series": [
{
"name": "s3v.large.2 by Orange Business",
"color": "#fa6600",
"data": [
{
"x": 724.3013345674029,
"y": 1403.000009625869
},
{
"x": 722.8273010327359,
"y": 1385.283872621716
},
{
"x": 732.7055114926692,
"y": 1402.3803801011732
},
{
"x": 721.2310410369377,
"y": 1355.5799373456382
},
{
"x": 723.149577909019,
"y": 1408.4694260652636
},
{
"x": 736.4531683646388,
"y": 1350.3956272749215
},
{
"x": 725.734172869301,
"y": 1394.918946365527
},
{
"x": 716.6465163354424,
"y": 1393.5623019939276
},
{
"x": 731.0605669236638,
"y": 1400.7572138679916
},
{
"x": 730.3252875561182,
"y": 1383.349599485488
},
{
"x": 727.8199036128544,
"y": 1406.08312022701
},
{
"x": 710.157229223207,
"y": 1398.121038759358
},
{
"x": 737.6965509197946,
"y": 1404.1152682358716
},
{
"x": 729.6490233580236,
"y": 1388.6490144035383
},
{
"x": 731.4204030199344,
"y": 1402.519584391459
},
{
"x": 717.1376470414962,
"y": 1398.4719792338972
},
{
"x": 727.7488969481087,
"y": 1386.913345589094
},
{
"x": 733.3961229990423,
"y": 1376.572348381482
},
{
"x": 738.9283896423552,
"y": 1401.0106431138872
},
{
"x": 710.824784154776,
"y": 1381.108320821687
}
]
}
],
"drilldown": {},
"tooltip": {
"enabled": true,
"useHTML": false,
"format": null,
"headerFormat": "",
"pointFormat": "<span style=\"color:{series.color}\">Single</span>: <b>{point.x:.0f}</b><br><span style=\"color:{series.color}\">Multi</span>: <b>{point.y:.0f}</b>",
"footerFormat": "",
"shared": false,
"outside": false,
"valueDecimals": null,
"split": false
},
"annotations": null
},
"hc_type": "chart",
"id": "95156048821728643019129879249172544575"
}
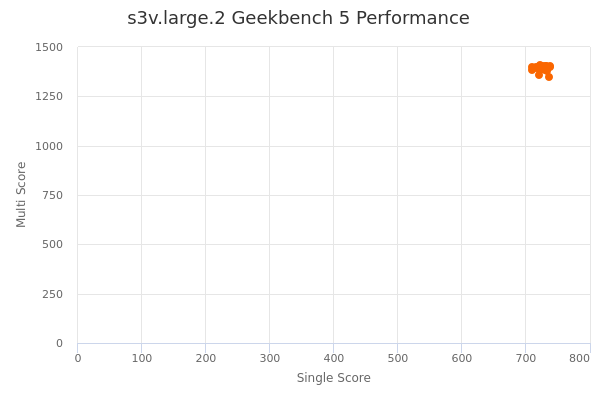
| Single | Multi | |
|---|---|---|
| Max | 739 | 1408 |
| Average | 726 | 1391 |
| Deviation | 8.04 | 15.42 |
| Min | 710 | 1350 |
Sign up as Freemium to get more insight.
- In same series
- s3v.small.1
- s3v.medium.4
- s3v.large.2
- s3v.large.4
- s3v.xlarge.2
- s3v.xlarge.4
- s3v.2xlarge.2