m6.3xlarge.8 by Orange Business
Geekbench is a cross-platform processor benchmark with a scoring system that determines single-core and multi-core performance using loads simulating real-world scenarios. Geekbench 5 score is calculated with a reference score of 2500 representing the performance of the Intel Core i5-2520M @ 2.50 GHz. The software benchmark is available for Mac OS, Windows, Linux, Android and iOS platforms.
Specifications:
CPU
12
RAM
96.0 GB
{
"configuration": {
"chart": {
"type": "scatter",
"polar": false,
"zoomType": "",
"options3d": {},
"height": null,
"width": null,
"margin": null,
"inverted": false,
"zooming": {}
},
"credits": {
"enabled": false
},
"title": {
"text": ""
},
"colorAxis": null,
"subtitle": {
"text": ""
},
"xAxis": {
"title": {
"text": [
"Single Score"
],
"useHTML": false,
"style": {
"color": "#666666"
}
},
"categories": null,
"lineWidth": 1,
"tickInterval": null,
"tickWidth": 1,
"tickLength": 10,
"tickPixelInterval": 100,
"plotLines": null,
"labels": {
"enabled": true,
"format": null,
"formatter": "",
"style": {
"color": "#666666",
"cursor": "default",
"fontSize": "11px"
},
"useHTML": false,
"step": 0
},
"plotBands": null,
"visible": true,
"floor": null,
"ceiling": null,
"type": "linear",
"min": 0,
"gridLineWidth": 1,
"gridLineColor": "#e6e6e6",
"minorTickInterval": null,
"minorTickWidth": 0,
"minTickInterval": null,
"startOnTick": true,
"endOnTick": true,
"tickmarkPlacement": 100,
"units": 100,
"minRange": 100
},
"yAxis": {
"title": {
"text": [
"Multi Score"
],
"useHTML": false,
"style": {
"color": "#666666"
}
},
"categories": null,
"plotLines": null,
"plotBands": null,
"lineWidth": null,
"tickInterval": null,
"tickLength": 10,
"floor": null,
"ceiling": null,
"gridLineInterpolation": null,
"gridLineWidth": 1,
"gridLineColor": "#e6e6e6",
"min": 0,
"max": null,
"minorTickInterval": null,
"minorTickWidth": 0,
"minTickInterval": null,
"startOnTick": true,
"endOnTick": true,
"minRange": null,
"type": "linear",
"tickmarkPlacement": null,
"labels": {
"enabled": true,
"formatter": null,
"style": {
"color": "#666666",
"cursor": "default",
"fontSize": "11px"
},
"useHTML": false
}
},
"zAxis": {
"title": {
"text": "Multi Score"
}
},
"plotOptions": {
"series": {
"dataLabels": {
"enabled": false,
"format": null,
"distance": 30,
"align": "center",
"inside": null,
"allowOverlap": false,
"style": {
"fontSize": "11px"
}
},
"showInLegend": null,
"turboThreshold": 0,
"stacking": "",
"groupPadding": 0.2,
"centerInCategory": false,
"findNearestPointBy": "x"
}
},
"navigator": {
"enabled": false
},
"scrollbar": {
"enabled": false
},
"rangeSelector": {
"enabled": false,
"inputEnabled": false
},
"legend": {
"enabled": null,
"maxHeight": null,
"align": "center",
"verticalAlign": "bottom",
"layout": "horizontal",
"width": null,
"margin": 12,
"reversed": false
},
"series": [
{
"name": "m6.3xlarge.8 by Orange Business",
"color": "#fa6600",
"data": [
{
"x": 901.3431170198337,
"y": 9941.450806221686
},
{
"x": 897.4748900615401,
"y": 9668.816849928684
},
{
"x": 900.8574580937284,
"y": 9759.557671245237
},
{
"x": 893.4064173046991,
"y": 9536.245142143649
},
{
"x": 900.3916302249512,
"y": 9896.925753380687
},
{
"x": 895.9708634996701,
"y": 9762.08843403209
},
{
"x": 899.8215489040549,
"y": 9966.684952129119
},
{
"x": 899.0622475066629,
"y": 9705.674688888128
},
{
"x": 902.7844309321106,
"y": 9999.749301384727
},
{
"x": 896.580114589147,
"y": 9743.501923733102
},
{
"x": 894.5662903425834,
"y": 9738.930919941082
},
{
"x": 901.866116947597,
"y": 9949.435073562236
},
{
"x": 896.1979358733174,
"y": 9788.552096148878
},
{
"x": 901.3052019975047,
"y": 9767.895357944733
},
{
"x": 901.4786955867719,
"y": 9495.967587458836
},
{
"x": 899.578147860328,
"y": 9877.568087209487
},
{
"x": 902.9723676668145,
"y": 9577.922765325286
},
{
"x": 904.4943178017426,
"y": 9904.216588817111
},
{
"x": 905.6619756248174,
"y": 9682.301735297484
},
{
"x": 894.7541120512817,
"y": 9892.086613197152
}
]
}
],
"drilldown": {},
"tooltip": {
"enabled": true,
"useHTML": false,
"format": null,
"headerFormat": "",
"pointFormat": "<span style=\"color:{series.color}\">Single</span>: <b>{point.x:.0f}</b><br><span style=\"color:{series.color}\">Multi</span>: <b>{point.y:.0f}</b>",
"footerFormat": "",
"shared": false,
"outside": false,
"valueDecimals": null,
"split": false
},
"annotations": null
},
"hc_type": "chart",
"id": "23941314505678789277141520236239982511"
}
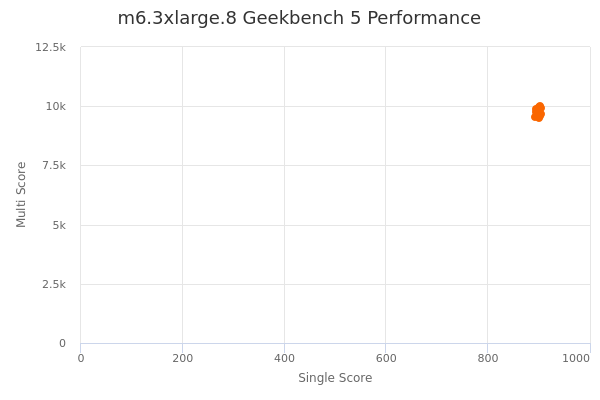
| Single | Multi | |
|---|---|---|
| Max | 906 | 10000 |
| Average | 900 | 9783 |
| Deviation | 3.35 | 141.65 |
| Min | 893 | 9496 |
Sign up as Freemium to get more insight.