m1.large by Orange Business
Geekbench is a cross-platform processor benchmark with a scoring system that determines single-core and multi-core performance using loads simulating real-world scenarios. Geekbench 5 score is calculated with a reference score of 2500 representing the performance of the Intel Core i5-2520M @ 2.50 GHz. The software benchmark is available for Mac OS, Windows, Linux, Android and iOS platforms.
Specifications:
CPU
2
RAM
16.0 GB
{
"configuration": {
"chart": {
"type": "scatter",
"polar": false,
"zoomType": "",
"options3d": {},
"height": null,
"width": null,
"margin": null,
"inverted": false,
"zooming": {}
},
"credits": {
"enabled": false
},
"title": {
"text": ""
},
"colorAxis": null,
"subtitle": {
"text": ""
},
"xAxis": {
"title": {
"text": [
"Single Score"
],
"useHTML": false,
"style": {
"color": "#666666"
}
},
"categories": null,
"lineWidth": 1,
"tickInterval": null,
"tickWidth": 1,
"tickLength": 10,
"tickPixelInterval": 100,
"plotLines": null,
"labels": {
"enabled": true,
"format": null,
"formatter": "",
"style": {
"color": "#666666",
"cursor": "default",
"fontSize": "11px"
},
"useHTML": false,
"step": 0
},
"plotBands": null,
"visible": true,
"floor": null,
"ceiling": null,
"type": "linear",
"min": 0,
"gridLineWidth": 1,
"gridLineColor": "#e6e6e6",
"minorTickInterval": null,
"minorTickWidth": 0,
"minTickInterval": null,
"startOnTick": true,
"endOnTick": true,
"tickmarkPlacement": 100,
"units": 100,
"minRange": 100
},
"yAxis": {
"title": {
"text": [
"Multi Score"
],
"useHTML": false,
"style": {
"color": "#666666"
}
},
"categories": null,
"plotLines": null,
"plotBands": null,
"lineWidth": null,
"tickInterval": null,
"tickLength": 10,
"floor": null,
"ceiling": null,
"gridLineInterpolation": null,
"gridLineWidth": 1,
"gridLineColor": "#e6e6e6",
"min": 0,
"max": null,
"minorTickInterval": null,
"minorTickWidth": 0,
"minTickInterval": null,
"startOnTick": true,
"endOnTick": true,
"minRange": null,
"type": "linear",
"tickmarkPlacement": null,
"labels": {
"enabled": true,
"formatter": null,
"style": {
"color": "#666666",
"cursor": "default",
"fontSize": "11px"
},
"useHTML": false
}
},
"zAxis": {
"title": {
"text": "Multi Score"
}
},
"plotOptions": {
"series": {
"dataLabels": {
"enabled": false,
"format": null,
"distance": 30,
"align": "center",
"inside": null,
"allowOverlap": false,
"style": {
"fontSize": "11px"
}
},
"showInLegend": null,
"turboThreshold": 0,
"stacking": "",
"groupPadding": 0.2,
"centerInCategory": false,
"findNearestPointBy": "x"
}
},
"navigator": {
"enabled": false
},
"scrollbar": {
"enabled": false
},
"rangeSelector": {
"enabled": false,
"inputEnabled": false
},
"legend": {
"enabled": null,
"maxHeight": null,
"align": "center",
"verticalAlign": "bottom",
"layout": "horizontal",
"width": null,
"margin": 12,
"reversed": false
},
"series": [
{
"name": "m1.large by Orange Business",
"color": "#fa6600",
"data": [
{
"x": 666.923573345392,
"y": 1293.0660155381124
},
{
"x": 623.5166994433993,
"y": 1174.1246517867312
},
{
"x": 658.8946485556185,
"y": 1295.2057571245025
},
{
"x": 582.2510656001781,
"y": 1093.6220980653284
},
{
"x": 655.1731891524386,
"y": 1311.5160091531827
},
{
"x": 571.6838188606471,
"y": 1075.3965144353347
},
{
"x": 658.9101980498258,
"y": 1312.628847677907
},
{
"x": 559.4073821187002,
"y": 1096.6933936788366
},
{
"x": 666.2726334491325,
"y": 1303.658452160032
},
{
"x": 579.5932539187103,
"y": 1119.9448977286997
},
{
"x": 664.1061334522884,
"y": 1296.8444705794225
},
{
"x": 580.236786724814,
"y": 1148.5302623709892
},
{
"x": 656.5266472353763,
"y": 1302.4024358044212
},
{
"x": 587.1806708346091,
"y": 1156.2878186896244
},
{
"x": 662.528919522406,
"y": 1282.2808880828986
},
{
"x": 583.5313163324438,
"y": 1149.6069649370615
},
{
"x": 669.4599887271306,
"y": 1307.082668101617
},
{
"x": 600.0846583657506,
"y": 1141.301648651714
},
{
"x": 655.5746772759145,
"y": 1263.0566921155294
},
{
"x": 592.2419950114768,
"y": 1151.1419780202573
},
{
"x": 606.8721365191885,
"y": 1190.8294821059808
},
{
"x": 588.2696473962721,
"y": 1148.8800059636974
},
{
"x": 605.9822490883984,
"y": 1189.5780822301863
},
{
"x": 594.9912591656407,
"y": 1154.285980202007
},
{
"x": 606.9414303557478,
"y": 1190.016718895743
},
{
"x": 591.993326728581,
"y": 1163.6602441913146
},
{
"x": 604.2456191695683,
"y": 1191.4617957513442
},
{
"x": 594.8148720614396,
"y": 1148.01534502396
},
{
"x": 609.2615449063694,
"y": 1197.54499163083
},
{
"x": 592.4187991470283,
"y": 1147.168661495607
},
{
"x": 604.6660637860266,
"y": 1196.1635990727375
},
{
"x": 592.4289296127131,
"y": 1158.6644094349026
},
{
"x": 606.0819706057121,
"y": 1195.2854283224883
},
{
"x": 585.8260070026711,
"y": 1170.3647128652933
},
{
"x": 603.5508710036498,
"y": 1189.8587515505765
},
{
"x": 589.4191692943959,
"y": 1155.8165760701359
},
{
"x": 604.2446254152318,
"y": 1189.014817284375
},
{
"x": 588.8150778157103,
"y": 1166.0188977776656
},
{
"x": 604.6438477592553,
"y": 1195.0143343356226
},
{
"x": 586.0597994127089,
"y": 1165.1631302349397
}
]
}
],
"drilldown": {},
"tooltip": {
"enabled": true,
"useHTML": false,
"format": null,
"headerFormat": "",
"pointFormat": "<span style=\"color:{series.color}\">Single</span>: <b>{point.x:.0f}</b><br><span style=\"color:{series.color}\">Multi</span>: <b>{point.y:.0f}</b>",
"footerFormat": "",
"shared": false,
"outside": false,
"valueDecimals": null,
"split": false
},
"annotations": null
},
"hc_type": "chart",
"id": "337379428570202759015050474508069950614"
}
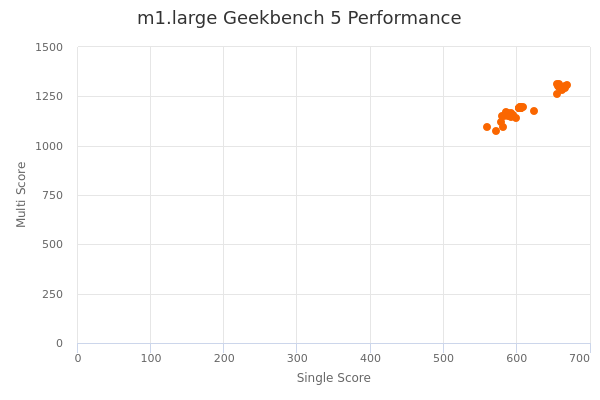
| Single | Multi | |
|---|---|---|
| Max | 669 | 1313 |
| Average | 611 | 1194 |
| Deviation | 31.31 | 65.39 |
| Min | 559 | 1075 |
Sign up as Freemium to get more insight.
- In same series
- m1.large
- m1.xlarge
- m1.2xlarge
- m1.4xlarge