i3.4xlarge.8 by Orange Business
Geekbench is a cross-platform processor benchmark with a scoring system that determines single-core and multi-core performance using loads simulating real-world scenarios. Geekbench 5 score is calculated with a reference score of 2500 representing the performance of the Intel Core i5-2520M @ 2.50 GHz. The software benchmark is available for Mac OS, Windows, Linux, Android and iOS platforms.
Specifications:
CPU
16
RAM
128.0 GB
Extra
1600 GB
NVMe SSD
{
"configuration": {
"chart": {
"type": "scatter",
"polar": false,
"zoomType": "",
"options3d": {},
"height": null,
"width": null,
"margin": null,
"inverted": false,
"zooming": {}
},
"credits": {
"enabled": false
},
"title": {
"text": ""
},
"colorAxis": null,
"subtitle": {
"text": ""
},
"xAxis": {
"title": {
"text": [
"Single Score"
],
"useHTML": false,
"style": {
"color": "#666666"
}
},
"categories": null,
"lineWidth": 1,
"tickInterval": null,
"tickWidth": 1,
"tickLength": 10,
"tickPixelInterval": 100,
"plotLines": null,
"labels": {
"enabled": true,
"format": null,
"formatter": "",
"style": {
"color": "#666666",
"cursor": "default",
"fontSize": "11px"
},
"useHTML": false,
"step": 0
},
"plotBands": null,
"visible": true,
"floor": null,
"ceiling": null,
"type": "linear",
"min": 0,
"gridLineWidth": 1,
"gridLineColor": "#e6e6e6",
"minorTickInterval": null,
"minorTickWidth": 0,
"minTickInterval": null,
"startOnTick": true,
"endOnTick": true,
"tickmarkPlacement": 100,
"units": 100,
"minRange": 100
},
"yAxis": {
"title": {
"text": [
"Multi Score"
],
"useHTML": false,
"style": {
"color": "#666666"
}
},
"categories": null,
"plotLines": null,
"plotBands": null,
"lineWidth": null,
"tickInterval": null,
"tickLength": 10,
"floor": null,
"ceiling": null,
"gridLineInterpolation": null,
"gridLineWidth": 1,
"gridLineColor": "#e6e6e6",
"min": 0,
"max": null,
"minorTickInterval": null,
"minorTickWidth": 0,
"minTickInterval": null,
"startOnTick": true,
"endOnTick": true,
"minRange": null,
"type": "linear",
"tickmarkPlacement": null,
"labels": {
"enabled": true,
"formatter": null,
"style": {
"color": "#666666",
"cursor": "default",
"fontSize": "11px"
},
"useHTML": false
}
},
"zAxis": {
"title": {
"text": "Multi Score"
}
},
"plotOptions": {
"series": {
"dataLabels": {
"enabled": false,
"format": null,
"distance": 30,
"align": "center",
"inside": null,
"allowOverlap": false,
"style": {
"fontSize": "11px"
}
},
"showInLegend": null,
"turboThreshold": 0,
"stacking": "",
"groupPadding": 0.2,
"centerInCategory": false,
"findNearestPointBy": "x"
}
},
"navigator": {
"enabled": false
},
"scrollbar": {
"enabled": false
},
"rangeSelector": {
"enabled": false,
"inputEnabled": false
},
"legend": {
"enabled": null,
"maxHeight": null,
"align": "center",
"verticalAlign": "bottom",
"layout": "horizontal",
"width": null,
"margin": 12,
"reversed": false
},
"series": [
{
"name": "i3.4xlarge.8 by Orange Business",
"color": "#fa6600",
"data": [
{
"x": 884.0449968548515,
"y": 11593.757708108096
},
{
"x": 886.0903637030351,
"y": 11859.70566669384
},
{
"x": 882.3520649122162,
"y": 11642.782752943493
},
{
"x": 887.7550817145997,
"y": 11878.976152184097
},
{
"x": 887.0820851127426,
"y": 11921.746751356543
},
{
"x": 886.0290385290087,
"y": 11787.446354047557
},
{
"x": 884.2498787879541,
"y": 11620.011848199516
},
{
"x": 893.3946522335735,
"y": 11626.593722914093
},
{
"x": 887.4778199220905,
"y": 11911.577560721253
},
{
"x": 892.3128518644814,
"y": 11900.734508482854
},
{
"x": 882.2225244861377,
"y": 11445.174053717721
},
{
"x": 890.7829551046666,
"y": 11717.119941422196
},
{
"x": 883.1581567841619,
"y": 11560.661588138093
},
{
"x": 889.5282646735049,
"y": 11799.281838848105
},
{
"x": 884.3744433479494,
"y": 11600.778595149297
},
{
"x": 888.2565601291808,
"y": 11743.40702656671
},
{
"x": 886.4336202299803,
"y": 11428.56776145528
},
{
"x": 890.3918936601463,
"y": 11497.575009492664
},
{
"x": 884.8034555225754,
"y": 11893.349799864252
},
{
"x": 891.4284463234633,
"y": 11654.612406160702
}
]
}
],
"drilldown": {},
"tooltip": {
"enabled": true,
"useHTML": false,
"format": null,
"headerFormat": "",
"pointFormat": "<span style=\"color:{series.color}\">Single</span>: <b>{point.x:.0f}</b><br><span style=\"color:{series.color}\">Multi</span>: <b>{point.y:.0f}</b>",
"footerFormat": "",
"shared": false,
"outside": false,
"valueDecimals": null,
"split": false
},
"annotations": null
},
"hc_type": "chart",
"id": "251915324837238878762466391657122252012"
}
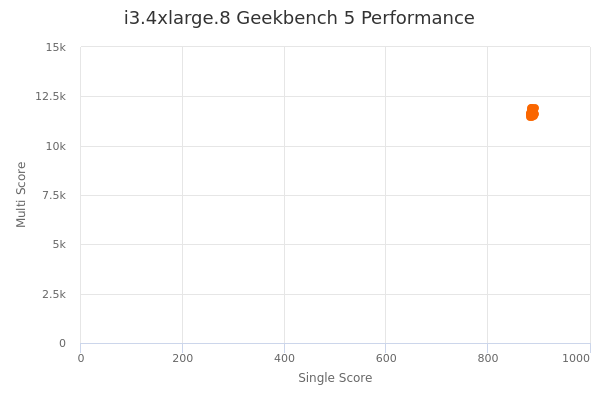
| Single | Multi | |
|---|---|---|
| Max | 893 | 11922 |
| Average | 887 | 11704 |
| Deviation | 3.26 | 155.84 |
| Min | 882 | 11429 |
Sign up as Freemium to get more insight.
- In same series
- i3.2xlarge.8
- i3.4xlarge.8
- i3.8xlarge.8
- i3.12xlarge.8
- i3.15xlarge.8