d3.4xlarge.8 by Orange Business
Geekbench is a cross-platform processor benchmark with a scoring system that determines single-core and multi-core performance using loads simulating real-world scenarios. Geekbench 5 score is calculated with a reference score of 2500 representing the performance of the Intel Core i5-2520M @ 2.50 GHz. The software benchmark is available for Mac OS, Windows, Linux, Android and iOS platforms.
Specifications:
CPU
16
RAM
128.0 GB
Extra
1675 GB
Magnetic
Net
20000 Mbps
{
"configuration": {
"chart": {
"type": "scatter",
"polar": false,
"zoomType": "",
"options3d": {},
"height": null,
"width": null,
"margin": null,
"inverted": false,
"zooming": {}
},
"credits": {
"enabled": false
},
"title": {
"text": ""
},
"colorAxis": null,
"subtitle": {
"text": ""
},
"xAxis": {
"title": {
"text": [
"Single Score"
],
"useHTML": false,
"style": {
"color": "#666666"
}
},
"categories": null,
"lineWidth": 1,
"tickInterval": null,
"tickWidth": 1,
"tickLength": 10,
"tickPixelInterval": 100,
"plotLines": null,
"labels": {
"enabled": true,
"format": null,
"formatter": "",
"style": {
"color": "#666666",
"cursor": "default",
"fontSize": "11px"
},
"useHTML": false,
"step": 0
},
"plotBands": null,
"visible": true,
"floor": null,
"ceiling": null,
"type": "linear",
"min": 0,
"gridLineWidth": 1,
"gridLineColor": "#e6e6e6",
"minorTickInterval": null,
"minorTickWidth": 0,
"minTickInterval": null,
"startOnTick": true,
"endOnTick": true,
"tickmarkPlacement": 100,
"units": 100,
"minRange": 100
},
"yAxis": {
"title": {
"text": [
"Multi Score"
],
"useHTML": false,
"style": {
"color": "#666666"
}
},
"categories": null,
"plotLines": null,
"plotBands": null,
"lineWidth": null,
"tickInterval": null,
"tickLength": 10,
"floor": null,
"ceiling": null,
"gridLineInterpolation": null,
"gridLineWidth": 1,
"gridLineColor": "#e6e6e6",
"min": 0,
"max": null,
"minorTickInterval": null,
"minorTickWidth": 0,
"minTickInterval": null,
"startOnTick": true,
"endOnTick": true,
"minRange": null,
"type": "linear",
"tickmarkPlacement": null,
"labels": {
"enabled": true,
"formatter": null,
"style": {
"color": "#666666",
"cursor": "default",
"fontSize": "11px"
},
"useHTML": false
}
},
"zAxis": {
"title": {
"text": "Multi Score"
}
},
"plotOptions": {
"series": {
"dataLabels": {
"enabled": false,
"format": null,
"distance": 30,
"align": "center",
"inside": null,
"allowOverlap": false,
"style": {
"fontSize": "11px"
}
},
"showInLegend": null,
"turboThreshold": 0,
"stacking": "",
"groupPadding": 0.2,
"centerInCategory": false,
"findNearestPointBy": "x"
}
},
"navigator": {
"enabled": false
},
"scrollbar": {
"enabled": false
},
"rangeSelector": {
"enabled": false,
"inputEnabled": false
},
"legend": {
"enabled": null,
"maxHeight": null,
"align": "center",
"verticalAlign": "bottom",
"layout": "horizontal",
"width": null,
"margin": 12,
"reversed": false
},
"series": [
{
"name": "d3.4xlarge.8 by Orange Business",
"color": "#fa6600",
"data": [
{
"x": 884.2901648159163,
"y": 11159.778577072175
},
{
"x": 848.3681576945235,
"y": 10111.222245420253
},
{
"x": 892.4370624691733,
"y": 9168.164931038305
},
{
"x": 847.1417107752376,
"y": 9659.946490814424
},
{
"x": 856.6032219022213,
"y": 11634.798928078677
},
{
"x": 825.9519662167424,
"y": 8762.273801819143
},
{
"x": 889.1176904577122,
"y": 9862.514982509005
},
{
"x": 881.8922163997763,
"y": 11024.505536100121
},
{
"x": 891.4127475747337,
"y": 10596.616713648995
},
{
"x": 864.2924640108834,
"y": 10816.337329370948
},
{
"x": 862.7316232512533,
"y": 10505.020142318566
},
{
"x": 876.335463652186,
"y": 10166.331030194939
},
{
"x": 891.1275395388415,
"y": 10805.008365488973
},
{
"x": 882.5992269194985,
"y": 10512.018839770142
},
{
"x": 858.3654277708551,
"y": 10557.130930052741
},
{
"x": 860.8492767921284,
"y": 11086.171493008473
},
{
"x": 874.6448097661403,
"y": 10966.203038934163
},
{
"x": 880.4924724335708,
"y": 10027.439873056133
},
{
"x": 895.621633243602,
"y": 9832.551949739714
},
{
"x": 878.7559699622087,
"y": 9976.854417278728
}
]
}
],
"drilldown": {},
"tooltip": {
"enabled": true,
"useHTML": false,
"format": null,
"headerFormat": "",
"pointFormat": "<span style=\"color:{series.color}\">Single</span>: <b>{point.x:.0f}</b><br><span style=\"color:{series.color}\">Multi</span>: <b>{point.y:.0f}</b>",
"footerFormat": "",
"shared": false,
"outside": false,
"valueDecimals": null,
"split": false
},
"annotations": null
},
"hc_type": "chart",
"id": "163333017042000216211381062111231013601"
}
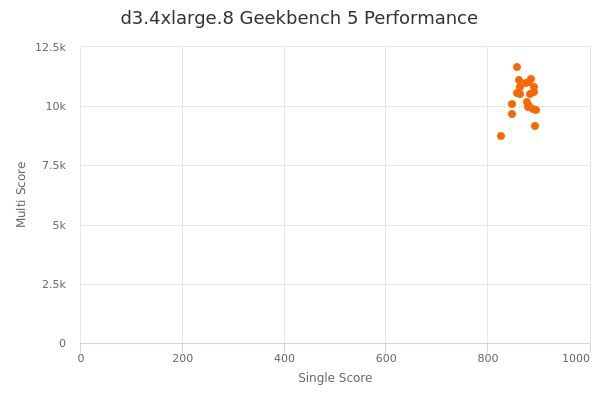
| Single | Multi | |
|---|---|---|
| Max | 896 | 11635 |
| Average | 872 | 10362 |
| Deviation | 18.03 | 688.92 |
| Min | 826 | 8762 |
Sign up as Freemium to get more insight.