c3.4xlarge.2 by Orange Business
Geekbench is a cross-platform processor benchmark with a scoring system that determines single-core and multi-core performance using loads simulating real-world scenarios. Geekbench 5 score is calculated with a reference score of 2500 representing the performance of the Intel Core i5-2520M @ 2.50 GHz. The software benchmark is available for Mac OS, Windows, Linux, Android and iOS platforms.
Specifications:
CPU
16
RAM
32.0 GB
{
"configuration": {
"chart": {
"type": "scatter",
"polar": false,
"zoomType": "",
"options3d": {},
"height": null,
"width": null,
"margin": null,
"inverted": false,
"zooming": {}
},
"credits": {
"enabled": false
},
"title": {
"text": ""
},
"colorAxis": null,
"subtitle": {
"text": ""
},
"xAxis": {
"title": {
"text": [
"Single Score"
],
"useHTML": false,
"style": {
"color": "#666666"
}
},
"categories": null,
"lineWidth": 1,
"tickInterval": null,
"tickWidth": 1,
"tickLength": 10,
"tickPixelInterval": 100,
"plotLines": null,
"labels": {
"enabled": true,
"format": null,
"formatter": "",
"style": {
"color": "#666666",
"cursor": "default",
"fontSize": "11px"
},
"useHTML": false,
"step": 0
},
"plotBands": null,
"visible": true,
"floor": null,
"ceiling": null,
"type": "linear",
"min": 0,
"gridLineWidth": 1,
"gridLineColor": "#e6e6e6",
"minorTickInterval": null,
"minorTickWidth": 0,
"minTickInterval": null,
"startOnTick": true,
"endOnTick": true,
"tickmarkPlacement": 100,
"units": 100,
"minRange": 100
},
"yAxis": {
"title": {
"text": [
"Multi Score"
],
"useHTML": false,
"style": {
"color": "#666666"
}
},
"categories": null,
"plotLines": null,
"plotBands": null,
"lineWidth": null,
"tickInterval": null,
"tickLength": 10,
"floor": null,
"ceiling": null,
"gridLineInterpolation": null,
"gridLineWidth": 1,
"gridLineColor": "#e6e6e6",
"min": 0,
"max": null,
"minorTickInterval": null,
"minorTickWidth": 0,
"minTickInterval": null,
"startOnTick": true,
"endOnTick": true,
"minRange": null,
"type": "linear",
"tickmarkPlacement": null,
"labels": {
"enabled": true,
"formatter": null,
"style": {
"color": "#666666",
"cursor": "default",
"fontSize": "11px"
},
"useHTML": false
}
},
"zAxis": {
"title": {
"text": "Multi Score"
}
},
"plotOptions": {
"series": {
"dataLabels": {
"enabled": false,
"format": null,
"distance": 30,
"align": "center",
"inside": null,
"allowOverlap": false,
"style": {
"fontSize": "11px"
}
},
"showInLegend": null,
"turboThreshold": 0,
"stacking": "",
"groupPadding": 0.2,
"centerInCategory": false,
"findNearestPointBy": "x"
}
},
"navigator": {
"enabled": false
},
"scrollbar": {
"enabled": false
},
"rangeSelector": {
"enabled": false,
"inputEnabled": false
},
"legend": {
"enabled": null,
"maxHeight": null,
"align": "center",
"verticalAlign": "bottom",
"layout": "horizontal",
"width": null,
"margin": 12,
"reversed": false
},
"series": [
{
"name": "c3.4xlarge.2 by Orange Business",
"color": "#fa6600",
"data": [
{
"x": 896.0898364545037,
"y": 7769.222360591684
},
{
"x": 893.8480924831699,
"y": 7794.445518385704
},
{
"x": 897.8322883904527,
"y": 7845.205356247737
},
{
"x": 892.02803310589,
"y": 7819.184298526393
},
{
"x": 901.7832795233523,
"y": 7958.673660387554
},
{
"x": 898.118282882907,
"y": 7785.85593027536
},
{
"x": 903.2359052366966,
"y": 7806.135182491637
},
{
"x": 894.3610039237378,
"y": 7823.791927443963
},
{
"x": 892.9792070088779,
"y": 7839.811869034874
},
{
"x": 884.1771082144037,
"y": 7810.451916588377
},
{
"x": 892.9864671041233,
"y": 7814.979405629305
},
{
"x": 884.6098423314891,
"y": 7753.767089855273
},
{
"x": 896.3596408888882,
"y": 7800.645514361593
},
{
"x": 882.678441339023,
"y": 7847.449724037382
},
{
"x": 898.6957268276323,
"y": 7805.205927940977
},
{
"x": 887.4772154828268,
"y": 7718.814945489043
},
{
"x": 902.6742306600297,
"y": 7859.4151711521645
},
{
"x": 882.3654766060479,
"y": 7775.15665678456
},
{
"x": 902.3695085720469,
"y": 7954.239824060833
},
{
"x": 882.8123566124754,
"y": 7806.645447463033
}
]
}
],
"drilldown": {},
"tooltip": {
"enabled": true,
"useHTML": false,
"format": null,
"headerFormat": "",
"pointFormat": "<span style=\"color:{series.color}\">Single</span>: <b>{point.x:.0f}</b><br><span style=\"color:{series.color}\">Multi</span>: <b>{point.y:.0f}</b>",
"footerFormat": "",
"shared": false,
"outside": false,
"valueDecimals": null,
"split": false
},
"annotations": null
},
"hc_type": "chart",
"id": "306765349647934166327625806061414986750"
}
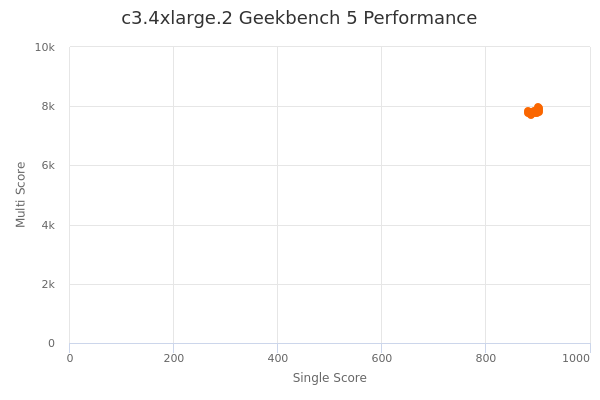
| Single | Multi | |
|---|---|---|
| Max | 903 | 7959 |
| Average | 893 | 7819 |
| Deviation | 6.96 | 55.99 |
| Min | 882 | 7719 |
Sign up as Freemium to get more insight.
- In same series
- c3.large.2
- c3.xlarge.2
- c3.2xlarge.2
- c3.4xlarge.2
- c3.8xlarge.2
- c3.15xlarge.2