c1.2xlarge by Orange Business
Geekbench is a cross-platform processor benchmark with a scoring system that determines single-core and multi-core performance using loads simulating real-world scenarios. Geekbench 5 score is calculated with a reference score of 2500 representing the performance of the Intel Core i5-2520M @ 2.50 GHz. The software benchmark is available for Mac OS, Windows, Linux, Android and iOS platforms.
Specifications:
CPU
8
RAM
8.0 GB
{
"configuration": {
"chart": {
"type": "scatter",
"polar": false,
"zoomType": "",
"options3d": {},
"height": null,
"width": null,
"margin": null,
"inverted": false,
"zooming": {}
},
"credits": {
"enabled": false
},
"title": {
"text": ""
},
"colorAxis": null,
"subtitle": {
"text": ""
},
"xAxis": {
"title": {
"text": [
"Single Score"
],
"useHTML": false,
"style": {
"color": "#666666"
}
},
"categories": null,
"lineWidth": 1,
"tickInterval": null,
"tickWidth": 1,
"tickLength": 10,
"tickPixelInterval": 100,
"plotLines": null,
"labels": {
"enabled": true,
"format": null,
"formatter": "",
"style": {
"color": "#666666",
"cursor": "default",
"fontSize": "11px"
},
"useHTML": false,
"step": 0
},
"plotBands": null,
"visible": true,
"floor": null,
"ceiling": null,
"type": "linear",
"min": 0,
"gridLineWidth": 1,
"gridLineColor": "#e6e6e6",
"minorTickInterval": null,
"minorTickWidth": 0,
"minTickInterval": null,
"startOnTick": true,
"endOnTick": true,
"tickmarkPlacement": 100,
"units": 100,
"minRange": 100
},
"yAxis": {
"title": {
"text": [
"Multi Score"
],
"useHTML": false,
"style": {
"color": "#666666"
}
},
"categories": null,
"plotLines": null,
"plotBands": null,
"lineWidth": null,
"tickInterval": null,
"tickLength": 10,
"floor": null,
"ceiling": null,
"gridLineInterpolation": null,
"gridLineWidth": 1,
"gridLineColor": "#e6e6e6",
"min": 0,
"max": null,
"minorTickInterval": null,
"minorTickWidth": 0,
"minTickInterval": null,
"startOnTick": true,
"endOnTick": true,
"minRange": null,
"type": "linear",
"tickmarkPlacement": null,
"labels": {
"enabled": true,
"formatter": null,
"style": {
"color": "#666666",
"cursor": "default",
"fontSize": "11px"
},
"useHTML": false
}
},
"zAxis": {
"title": {
"text": "Multi Score"
}
},
"plotOptions": {
"series": {
"dataLabels": {
"enabled": false,
"format": null,
"distance": 30,
"align": "center",
"inside": null,
"allowOverlap": false,
"style": {
"fontSize": "11px"
}
},
"showInLegend": null,
"turboThreshold": 0,
"stacking": "",
"groupPadding": 0.2,
"centerInCategory": false,
"findNearestPointBy": "x"
}
},
"navigator": {
"enabled": false
},
"scrollbar": {
"enabled": false
},
"rangeSelector": {
"enabled": false,
"inputEnabled": false
},
"legend": {
"enabled": null,
"maxHeight": null,
"align": "center",
"verticalAlign": "bottom",
"layout": "horizontal",
"width": null,
"margin": 12,
"reversed": false
},
"series": [
{
"name": "c1.2xlarge by Orange Business",
"color": "#fa6600",
"data": [
{
"x": 631.6732367709525,
"y": 4568.72666969177
},
{
"x": 620.3590043214966,
"y": 3836.5983066081026
},
{
"x": 629.0911304551978,
"y": 4555.842436879385
},
{
"x": 610.8141861177191,
"y": 3735.0510045253795
},
{
"x": 633.6747321297155,
"y": 4546.948164379496
},
{
"x": 580.5163848457305,
"y": 3686.57470645179
},
{
"x": 630.606024740604,
"y": 4523.168421526171
},
{
"x": 591.7914625009469,
"y": 3877.171091595422
},
{
"x": 628.369905182073,
"y": 4572.015016169485
},
{
"x": 607.8180649582368,
"y": 3659.1978783523937
},
{
"x": 635.110176876441,
"y": 4581.510296841945
},
{
"x": 607.9535185888824,
"y": 3780.634693995239
},
{
"x": 625.6179943834198,
"y": 4579.795478683935
},
{
"x": 632.96815028704,
"y": 4623.949715369088
},
{
"x": 627.7445541504916,
"y": 4555.776173473516
},
{
"x": 638.710731546432,
"y": 3949.076710113713
},
{
"x": 622.4783418240894,
"y": 4544.737408803234
},
{
"x": 630.1403862212813,
"y": 4000.1776812904573
},
{
"x": 624.6884858547203,
"y": 4517.769397929534
},
{
"x": 618.0547623887819,
"y": 4253.940552616618
},
{
"x": 620.3005425086466,
"y": 4429.803760696952
},
{
"x": 565.8966976707534,
"y": 3762.7389950447287
},
{
"x": 624.8633921073861,
"y": 4495.714239908822
},
{
"x": 554.1505625552383,
"y": 3788.4823045130297
},
{
"x": 622.2703270217879,
"y": 4494.153578216976
},
{
"x": 563.8815307729536,
"y": 3897.0880991190443
},
{
"x": 625.3895436877988,
"y": 4495.059135171252
},
{
"x": 560.3874916503693,
"y": 3874.414854622424
},
{
"x": 620.873516203618,
"y": 4515.699844425375
},
{
"x": 562.5656559700394,
"y": 3778.0984097604046
},
{
"x": 627.3542693938475,
"y": 4516.909694039352
},
{
"x": 562.1275032420699,
"y": 3826.5004405027203
},
{
"x": 619.255471732177,
"y": 4470.499253643669
},
{
"x": 559.8784682910677,
"y": 3912.226818036609
},
{
"x": 622.7881686037267,
"y": 4509.564287783332
},
{
"x": 562.8736592481964,
"y": 4336.3546093755085
},
{
"x": 617.2748724533368,
"y": 4485.517489713616
},
{
"x": 606.9842764543893,
"y": 4395.574875865664
},
{
"x": 621.9127005477335,
"y": 4500.944407998799
},
{
"x": 565.3007332416976,
"y": 3951.2490857947023
}
]
}
],
"drilldown": {},
"tooltip": {
"enabled": true,
"useHTML": false,
"format": null,
"headerFormat": "",
"pointFormat": "<span style=\"color:{series.color}\">Single</span>: <b>{point.x:.0f}</b><br><span style=\"color:{series.color}\">Multi</span>: <b>{point.y:.0f}</b>",
"footerFormat": "",
"shared": false,
"outside": false,
"valueDecimals": null,
"split": false
},
"annotations": null
},
"hc_type": "chart",
"id": "89318124460181554640364174443594245465"
}
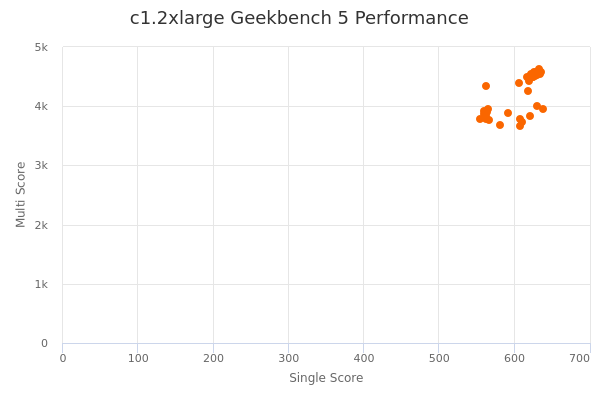
| Single | Multi | |
|---|---|---|
| Max | 639 | 4624 |
| Average | 608 | 4235 |
| Deviation | 27.01 | 339.72 |
| Min | 554 | 3659 |
Sign up as Freemium to get more insight.
- In same series
- c1.large
- c1.xlarge
- c1.2xlarge
- c1.4xlarge