VM.Standard.E3.Flex.8-32 by Oracle Cloud
Geekbench is a cross-platform processor benchmark with a scoring system that determines single-core and multi-core performance using loads simulating real-world scenarios. Geekbench 5 score is calculated with a reference score of 2500 representing the performance of the Intel Core i5-2520M @ 2.50 GHz. The software benchmark is available for Mac OS, Windows, Linux, Android and iOS platforms.
Specifications:
CPU
16
RAM
32.0 GB
Net
8000 Mbps
{
"configuration": {
"chart": {
"type": "scatter",
"polar": false,
"zoomType": "",
"options3d": {},
"height": null,
"width": null,
"margin": null,
"inverted": false,
"zooming": {}
},
"credits": {
"enabled": false
},
"title": {
"text": ""
},
"colorAxis": null,
"subtitle": {
"text": ""
},
"xAxis": {
"title": {
"text": [
"Single Score"
],
"useHTML": false,
"style": {
"color": "#666666"
}
},
"categories": null,
"lineWidth": 1,
"tickInterval": null,
"tickWidth": 1,
"tickLength": 10,
"tickPixelInterval": 100,
"plotLines": null,
"labels": {
"enabled": true,
"format": null,
"formatter": "",
"style": {
"color": "#666666",
"cursor": "default",
"fontSize": "11px"
},
"useHTML": false,
"step": 0
},
"plotBands": null,
"visible": true,
"floor": null,
"ceiling": null,
"type": "linear",
"min": 0,
"gridLineWidth": 1,
"gridLineColor": "#e6e6e6",
"minorTickInterval": null,
"minorTickWidth": 0,
"minTickInterval": null,
"startOnTick": true,
"endOnTick": true,
"tickmarkPlacement": 100,
"units": 100,
"minRange": 100
},
"yAxis": {
"title": {
"text": [
"Multi Score"
],
"useHTML": false,
"style": {
"color": "#666666"
}
},
"categories": null,
"plotLines": null,
"plotBands": null,
"lineWidth": null,
"tickInterval": null,
"tickLength": 10,
"floor": null,
"ceiling": null,
"gridLineInterpolation": null,
"gridLineWidth": 1,
"gridLineColor": "#e6e6e6",
"min": 0,
"max": null,
"minorTickInterval": null,
"minorTickWidth": 0,
"minTickInterval": null,
"startOnTick": true,
"endOnTick": true,
"minRange": null,
"type": "linear",
"tickmarkPlacement": null,
"labels": {
"enabled": true,
"formatter": null,
"style": {
"color": "#666666",
"cursor": "default",
"fontSize": "11px"
},
"useHTML": false
}
},
"zAxis": {
"title": {
"text": "Multi Score"
}
},
"plotOptions": {
"series": {
"dataLabels": {
"enabled": false,
"format": null,
"distance": 30,
"align": "center",
"inside": null,
"allowOverlap": false,
"style": {
"fontSize": "11px"
}
},
"showInLegend": null,
"turboThreshold": 0,
"stacking": "",
"groupPadding": 0.2,
"centerInCategory": false,
"findNearestPointBy": "x"
}
},
"navigator": {
"enabled": false
},
"scrollbar": {
"enabled": false
},
"rangeSelector": {
"enabled": false,
"inputEnabled": false
},
"legend": {
"enabled": null,
"maxHeight": null,
"align": "center",
"verticalAlign": "bottom",
"layout": "horizontal",
"width": null,
"margin": 12,
"reversed": false
},
"series": [
{
"name": "VM.Standard.E3.Flex.8-32 by Oracle Cloud",
"color": "#FF0000",
"data": [
{
"x": 966.3711997599708,
"y": 7789.69679519935
},
{
"x": 952.5641004848253,
"y": 7564.450008142692
},
{
"x": 969.9259665526903,
"y": 7628.313583293953
},
{
"x": 959.9839096815649,
"y": 7778.460651567648
},
{
"x": 958.2932938314157,
"y": 7796.130291581647
},
{
"x": 952.5389420838451,
"y": 7623.908500926629
},
{
"x": 966.9220038350882,
"y": 7930.251825959778
},
{
"x": 953.8484574436411,
"y": 7913.830508139439
},
{
"x": 964.7801981088035,
"y": 7879.395605312626
},
{
"x": 960.9633051345747,
"y": 7629.440489593089
},
{
"x": 967.7497211207813,
"y": 8043.9692649283925
},
{
"x": 949.5179017752333,
"y": 7765.683993849677
},
{
"x": 967.9870902700482,
"y": 8536.9528916054
},
{
"x": 965.963431572168,
"y": 7813.727734091174
},
{
"x": 967.7544414188894,
"y": 8267.961974278205
},
{
"x": 941.063525495776,
"y": 7757.530582723982
},
{
"x": 959.1432408711439,
"y": 8279.552090360094
},
{
"x": 945.7943708813234,
"y": 7822.911832023419
},
{
"x": 964.5430262136911,
"y": 8505.311167277288
},
{
"x": 940.5927542296258,
"y": 7619.528792802967
},
{
"x": 962.0330943576478,
"y": 8047.064648098235
},
{
"x": 949.0571476357497,
"y": 7928.960297088679
},
{
"x": 966.7353505970497,
"y": 8048.959593471993
},
{
"x": 952.4885289917563,
"y": 7791.180183090435
},
{
"x": 962.9871819631683,
"y": 8354.876593505756
},
{
"x": 939.0717786873934,
"y": 7946.949094210508
},
{
"x": 968.0322865383238,
"y": 8374.00094039064
},
{
"x": 938.8194710684525,
"y": 7736.69399746004
},
{
"x": 957.5939526142936,
"y": 8151.070257075553
},
{
"x": 943.5572466411459,
"y": 7578.812663054091
},
{
"x": 970.2262609009779,
"y": 8550.83997453795
},
{
"x": 958.5606668651237,
"y": 8096.360637049631
},
{
"x": 966.8127419749002,
"y": 8413.229677500854
},
{
"x": 943.2826877465959,
"y": 7543.059285923973
},
{
"x": 969.0193662350916,
"y": 8553.586051087443
},
{
"x": 950.1317330048084,
"y": 7659.4799760911865
},
{
"x": 968.0306445364422,
"y": 8196.37898466071
},
{
"x": 961.8172545772102,
"y": 7831.673459560876
},
{
"x": 967.6573027783915,
"y": 8242.917127773464
},
{
"x": 961.7296916766545,
"y": 8116.56421882279
},
{
"x": 966.9215201418324,
"y": 8521.908494229452
},
{
"x": 964.5423120659627,
"y": 7578.356434916173
},
{
"x": 966.5694028246467,
"y": 8046.798334912451
},
{
"x": 961.9737153416986,
"y": 7698.141420720287
},
{
"x": 964.6192089445257,
"y": 7940.682466238068
},
{
"x": 962.1381826786944,
"y": 7998.788883904363
},
{
"x": 958.8189574077328,
"y": 8023.795802526936
},
{
"x": 947.0973716951615,
"y": 7771.900483732163
},
{
"x": 955.1906133965242,
"y": 8235.053914623222
},
{
"x": 956.6333927991531,
"y": 7745.2373865859145
},
{
"x": 966.3036044961743,
"y": 8425.777808547266
},
{
"x": 961.8409936024348,
"y": 7714.559712123355
},
{
"x": 972.2752654112314,
"y": 8061.948147548535
},
{
"x": 947.608827977629,
"y": 8083.90578741826
},
{
"x": 965.5931777835585,
"y": 8542.952829704336
},
{
"x": 964.8482040793504,
"y": 7628.640595901681
},
{
"x": 967.2150099719265,
"y": 8271.365208983223
},
{
"x": 958.5084553138715,
"y": 7671.832216409259
}
]
}
],
"drilldown": {},
"tooltip": {
"enabled": true,
"useHTML": false,
"format": null,
"headerFormat": "",
"pointFormat": "<span style=\"color:{series.color}\">Single</span>: <b>{point.x:.0f}</b><br><span style=\"color:{series.color}\">Multi</span>: <b>{point.y:.0f}</b>",
"footerFormat": "",
"shared": false,
"outside": false,
"valueDecimals": null,
"split": false
},
"annotations": null
},
"hc_type": "chart",
"id": "333160999175408674729676362135709809869"
}
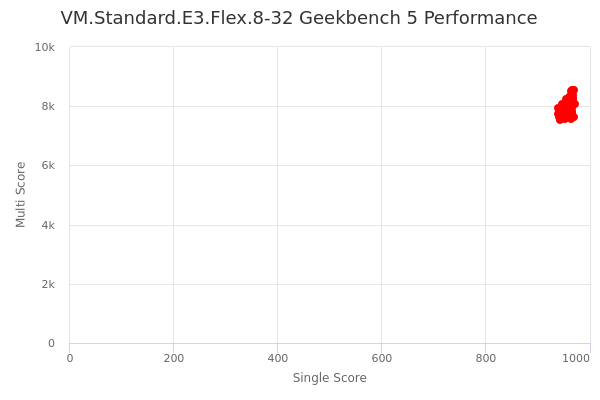
| Single | Multi | |
|---|---|---|
| Max | 972 | 8554 |
| Average | 959 | 7984 |
| Deviation | 8.93 | 300.19 |
| Min | 939 | 7543 |
Sign up as Freemium to get more insight.
- In same series
- VM.Standard.E3.Flex.1-1
- VM.Standard.E3.Flex.1-2
- VM.Standard.E3.Flex.1-3
- VM.Standard.E3.Flex.1-4
- VM.Standard.E3.Flex.1-6
- VM.Standard.E3.Flex.1-8
- VM.Standard.E3.Flex.1-12
- VM.Standard.E3.Flex.1-16
- VM.Standard.E3.Flex.1-24
- VM.Standard.E3.Flex.1-32
- VM.Standard.E3.Flex.1-48
- VM.Standard.E3.Flex.1-64
- VM.Standard.E3.Flex.2-2
- VM.Standard.E3.Flex.2-3
- VM.Standard.E3.Flex.2-4
- VM.Standard.E3.Flex.2-6
- VM.Standard.E3.Flex.2-8
- VM.Standard.E3.Flex.2-12
- VM.Standard.E3.Flex.2-16
- VM.Standard.E3.Flex.2-24
- VM.Standard.E3.Flex.2-32
- VM.Standard.E3.Flex.2-48
- VM.Standard.E3.Flex.2-64
- VM.Standard.E3.Flex.2-128
- VM.Standard.E3.Flex.2-192
- VM.Standard.E3.Flex.3-3
- VM.Standard.E3.Flex.3-4
- VM.Standard.E3.Flex.3-6
- VM.Standard.E3.Flex.3-8
- VM.Standard.E3.Flex.3-12
- VM.Standard.E3.Flex.3-16
- VM.Standard.E3.Flex.3-24
- VM.Standard.E3.Flex.3-32
- VM.Standard.E3.Flex.3-48
- VM.Standard.E3.Flex.3-64
- VM.Standard.E3.Flex.3-128
- VM.Standard.E3.Flex.3-192
- VM.Standard.E3.Flex.3-256
- VM.Standard.E3.Flex.4-4
- VM.Standard.E3.Flex.4-6
- VM.Standard.E3.Flex.4-8
- VM.Standard.E3.Flex.4-12
- VM.Standard.E3.Flex.4-16
- VM.Standard.E3.Flex.4-24
- VM.Standard.E3.Flex.4-32
- VM.Standard.E3.Flex.4-48
- VM.Standard.E3.Flex.4-64
- VM.Standard.E3.Flex.4-128
- VM.Standard.E3.Flex.4-192
- VM.Standard.E3.Flex.4-256
- VM.Standard.E3.Flex.4-384
- VM.Standard.E3.Flex.6-6
- VM.Standard.E3.Flex.6-8
- VM.Standard.E3.Flex.6-12
- VM.Standard.E3.Flex.6-16
- VM.Standard.E3.Flex.6-24
- VM.Standard.E3.Flex.6-32
- VM.Standard.E3.Flex.6-48
- VM.Standard.E3.Flex.6-64
- VM.Standard.E3.Flex.6-128
- VM.Standard.E3.Flex.6-192
- VM.Standard.E3.Flex.6-256
- VM.Standard.E3.Flex.6-384
- VM.Standard.E3.Flex.6-512
- VM.Standard.E3.Flex.8-8
- VM.Standard.E3.Flex.8-12
- VM.Standard.E3.Flex.8-16
- VM.Standard.E3.Flex.8-24
- VM.Standard.E3.Flex.8-32
- VM.Standard.E3.Flex.8-48
- VM.Standard.E3.Flex.8-64
- VM.Standard.E3.Flex.8-128
- VM.Standard.E3.Flex.8-192
- VM.Standard.E3.Flex.8-256
- VM.Standard.E3.Flex.8-384
- VM.Standard.E3.Flex.8-512
- VM.Standard.E3.Flex.8-768
- VM.Standard.E3.Flex.12-12
- VM.Standard.E3.Flex.12-16
- VM.Standard.E3.Flex.12-24
- VM.Standard.E3.Flex.12-32
- VM.Standard.E3.Flex.12-48
- VM.Standard.E3.Flex.12-64
- VM.Standard.E3.Flex.12-128
- VM.Standard.E3.Flex.12-192
- VM.Standard.E3.Flex.12-256
- VM.Standard.E3.Flex.12-384
- VM.Standard.E3.Flex.12-512
- VM.Standard.E3.Flex.12-768
- VM.Standard.E3.Flex.12-1024
- VM.Standard.E3.Flex.16-16
- VM.Standard.E3.Flex.16-24
- VM.Standard.E3.Flex.16-32
- VM.Standard.E3.Flex.16-48
- VM.Standard.E3.Flex.16-64
- VM.Standard.E3.Flex.16-128
- VM.Standard.E3.Flex.16-192
- VM.Standard.E3.Flex.16-256
- VM.Standard.E3.Flex.16-384
- VM.Standard.E3.Flex.16-512
- VM.Standard.E3.Flex.16-768
- VM.Standard.E3.Flex.16-1024
- VM.Standard.E3.Flex.24-24
- VM.Standard.E3.Flex.24-32
- VM.Standard.E3.Flex.24-48
- VM.Standard.E3.Flex.24-64
- VM.Standard.E3.Flex.24-128
- VM.Standard.E3.Flex.24-192
- VM.Standard.E3.Flex.24-256
- VM.Standard.E3.Flex.24-384
- VM.Standard.E3.Flex.24-512
- VM.Standard.E3.Flex.24-768
- VM.Standard.E3.Flex.24-1024
- VM.Standard.E3.Flex.32-32
- VM.Standard.E3.Flex.32-48
- VM.Standard.E3.Flex.32-64
- VM.Standard.E3.Flex.32-128
- VM.Standard.E3.Flex.32-192
- VM.Standard.E3.Flex.32-256
- VM.Standard.E3.Flex.32-384
- VM.Standard.E3.Flex.32-512
- VM.Standard.E3.Flex.32-768
- VM.Standard.E3.Flex.32-1024
- VM.Standard.E3.Flex.48-48
- VM.Standard.E3.Flex.48-64
- VM.Standard.E3.Flex.48-128
- VM.Standard.E3.Flex.48-192
- VM.Standard.E3.Flex.48-256
- VM.Standard.E3.Flex.48-384
- VM.Standard.E3.Flex.48-512
- VM.Standard.E3.Flex.48-768
- VM.Standard.E3.Flex.48-1024
- VM.Standard.E3.Flex.64-64
- VM.Standard.E3.Flex.64-128
- VM.Standard.E3.Flex.64-192
- VM.Standard.E3.Flex.64-256
- VM.Standard.E3.Flex.64-384
- VM.Standard.E3.Flex.64-512
- VM.Standard.E3.Flex.64-768
- VM.Standard.E3.Flex.64-1024
- VM.Standard.E3.Flex.80-128
- VM.Standard.E3.Flex.80-192
- VM.Standard.E3.Flex.80-256
- VM.Standard.E3.Flex.80-384
- VM.Standard.E3.Flex.80-512
- VM.Standard.E3.Flex.80-768
- VM.Standard.E3.Flex.80-1024