BM.Standard2.52 by Oracle Cloud
Geekbench is a cross-platform processor benchmark with a scoring system that determines single-core and multi-core performance using loads simulating real-world scenarios. Geekbench 5 score is calculated with a reference score of 2500 representing the performance of the Intel Core i5-2520M @ 2.50 GHz. The software benchmark is available for Mac OS, Windows, Linux, Android and iOS platforms.
Specifications:
CPU
104
RAM
750.0 GB
Net
50000 Mbps
{
"configuration": {
"chart": {
"type": "scatter",
"polar": false,
"zoomType": "",
"options3d": {},
"height": null,
"width": null,
"margin": null,
"inverted": false,
"zooming": {}
},
"credits": {
"enabled": false
},
"title": {
"text": ""
},
"colorAxis": null,
"subtitle": {
"text": ""
},
"xAxis": {
"title": {
"text": [
"Single Score"
],
"useHTML": false,
"style": {
"color": "#666666"
}
},
"categories": null,
"lineWidth": 1,
"tickInterval": null,
"tickWidth": 1,
"tickLength": 10,
"tickPixelInterval": 100,
"plotLines": null,
"labels": {
"enabled": true,
"format": null,
"formatter": "",
"style": {
"color": "#666666",
"cursor": "default",
"fontSize": "11px"
},
"useHTML": false,
"step": 0
},
"plotBands": null,
"visible": true,
"floor": null,
"ceiling": null,
"type": "linear",
"min": 0,
"gridLineWidth": 1,
"gridLineColor": "#e6e6e6",
"minorTickInterval": null,
"minorTickWidth": 0,
"minTickInterval": null,
"startOnTick": true,
"endOnTick": true,
"tickmarkPlacement": 100,
"units": 100,
"minRange": 100
},
"yAxis": {
"title": {
"text": [
"Multi Score"
],
"useHTML": false,
"style": {
"color": "#666666"
}
},
"categories": null,
"plotLines": null,
"plotBands": null,
"lineWidth": null,
"tickInterval": null,
"tickLength": 10,
"floor": null,
"ceiling": null,
"gridLineInterpolation": null,
"gridLineWidth": 1,
"gridLineColor": "#e6e6e6",
"min": 0,
"max": null,
"minorTickInterval": null,
"minorTickWidth": 0,
"minTickInterval": null,
"startOnTick": true,
"endOnTick": true,
"minRange": null,
"type": "linear",
"tickmarkPlacement": null,
"labels": {
"enabled": true,
"formatter": null,
"style": {
"color": "#666666",
"cursor": "default",
"fontSize": "11px"
},
"useHTML": false
}
},
"zAxis": {
"title": {
"text": "Multi Score"
}
},
"plotOptions": {
"series": {
"dataLabels": {
"enabled": false,
"format": null,
"distance": 30,
"align": "center",
"inside": null,
"allowOverlap": false,
"style": {
"fontSize": "11px"
}
},
"showInLegend": null,
"turboThreshold": 0,
"stacking": "",
"groupPadding": 0.2,
"centerInCategory": false,
"findNearestPointBy": "x"
}
},
"navigator": {
"enabled": false
},
"scrollbar": {
"enabled": false
},
"rangeSelector": {
"enabled": false,
"inputEnabled": false
},
"legend": {
"enabled": null,
"maxHeight": null,
"align": "center",
"verticalAlign": "bottom",
"layout": "horizontal",
"width": null,
"margin": 12,
"reversed": false
},
"series": [
{
"name": "BM.Standard2.52 by Oracle Cloud",
"color": "#FF0000",
"data": [
{
"x": 702.4607763890084,
"y": 26469.262257013583
},
{
"x": 702.4580307221205,
"y": 26382.273948247403
},
{
"x": 703.0168780531533,
"y": 26023.195879668554
},
{
"x": 700.996468548118,
"y": 26692.445848927935
},
{
"x": 700.8411348971281,
"y": 27366.321748875678
},
{
"x": 701.5679159448682,
"y": 26654.013989936328
},
{
"x": 702.3390238473228,
"y": 27108.366878791374
},
{
"x": 701.1441583616789,
"y": 27360.43782526638
},
{
"x": 701.5409806165826,
"y": 26484.36877140596
},
{
"x": 702.0888257280246,
"y": 26934.09719132998
},
{
"x": 702.4995695440955,
"y": 26827.827245868866
},
{
"x": 701.2707524280188,
"y": 27125.674982260156
},
{
"x": 702.4586317022047,
"y": 26377.11965231597
},
{
"x": 701.3704714005225,
"y": 26927.55602429594
},
{
"x": 701.1891601652945,
"y": 26739.09762235861
},
{
"x": 702.6082351751186,
"y": 26960.76858474567
},
{
"x": 704.8753879722639,
"y": 27227.310161906255
},
{
"x": 703.0306078092094,
"y": 26655.403208564217
},
{
"x": 701.0738645854499,
"y": 27771.764704893892
},
{
"x": 702.849329693219,
"y": 27213.624613397304
}
]
}
],
"drilldown": {},
"tooltip": {
"enabled": true,
"useHTML": false,
"format": null,
"headerFormat": "",
"pointFormat": "<span style=\"color:{series.color}\">Single</span>: <b>{point.x:.0f}</b><br><span style=\"color:{series.color}\">Multi</span>: <b>{point.y:.0f}</b>",
"footerFormat": "",
"shared": false,
"outside": false,
"valueDecimals": null,
"split": false
},
"annotations": null
},
"hc_type": "chart",
"id": "202057646751286870254903287449119999594"
}
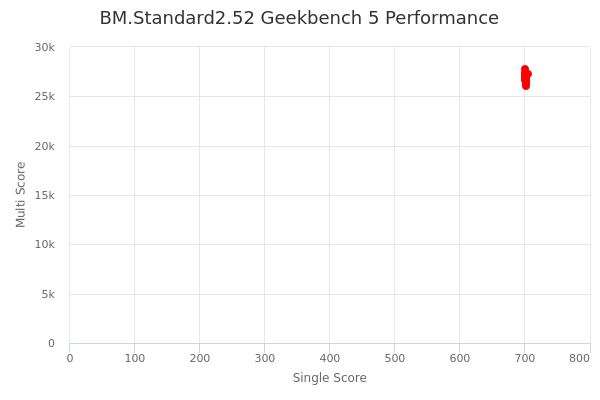
| Single | Multi | |
|---|---|---|
| Max | 705 | 27772 |
| Average | 702 | 26865 |
| Deviation | 0.96 | 408.26 |
| Min | 701 | 26023 |
Sign up as Freemium to get more insight.
- In same series
- BM.Standard2.52