en1.xsmall by leafcloud
Geekbench is a cross-platform processor benchmark with a scoring system that determines single-core and multi-core performance using loads simulating real-world scenarios. Geekbench 5 score is calculated with a reference score of 2500 representing the performance of the Intel Core i5-2520M @ 2.50 GHz. The software benchmark is available for Mac OS, Windows, Linux, Android and iOS platforms.
Specifications:
CPU
1
RAM
2.0 GB
Root
20 GB
en1.xsmall Root SSD
{
"configuration": {
"chart": {
"type": "scatter",
"polar": false,
"zoomType": "",
"options3d": {},
"height": null,
"width": null,
"margin": null,
"inverted": false,
"zooming": {}
},
"credits": {
"enabled": false
},
"title": {
"text": ""
},
"colorAxis": null,
"subtitle": {
"text": ""
},
"xAxis": {
"title": {
"text": [
"Single Score"
],
"useHTML": false,
"style": {
"color": "#666666"
}
},
"categories": null,
"lineWidth": 1,
"tickInterval": null,
"tickWidth": 1,
"tickLength": 10,
"tickPixelInterval": 100,
"plotLines": null,
"labels": {
"enabled": true,
"format": null,
"formatter": "",
"style": {
"color": "#666666",
"cursor": "default",
"fontSize": "11px"
},
"useHTML": false,
"step": 0
},
"plotBands": null,
"visible": true,
"floor": null,
"ceiling": null,
"type": "linear",
"min": 0,
"gridLineWidth": 1,
"gridLineColor": "#e6e6e6",
"minorTickInterval": null,
"minorTickWidth": 0,
"minTickInterval": null,
"startOnTick": true,
"endOnTick": true,
"tickmarkPlacement": 100,
"units": 100,
"minRange": 100
},
"yAxis": {
"title": {
"text": [
"Multi Score"
],
"useHTML": false,
"style": {
"color": "#666666"
}
},
"categories": null,
"plotLines": null,
"plotBands": null,
"lineWidth": null,
"tickInterval": null,
"tickLength": 10,
"floor": null,
"ceiling": null,
"gridLineInterpolation": null,
"gridLineWidth": 1,
"gridLineColor": "#e6e6e6",
"min": 0,
"max": null,
"minorTickInterval": null,
"minorTickWidth": 0,
"minTickInterval": null,
"startOnTick": true,
"endOnTick": true,
"minRange": null,
"type": "linear",
"tickmarkPlacement": null,
"labels": {
"enabled": true,
"formatter": null,
"style": {
"color": "#666666",
"cursor": "default",
"fontSize": "11px"
},
"useHTML": false
}
},
"zAxis": {
"title": {
"text": "Multi Score"
}
},
"plotOptions": {
"series": {
"dataLabels": {
"enabled": false,
"format": null,
"distance": 30,
"align": "center",
"inside": null,
"allowOverlap": false,
"style": {
"fontSize": "11px"
}
},
"showInLegend": null,
"turboThreshold": 0,
"stacking": "",
"groupPadding": 0.2,
"centerInCategory": false,
"findNearestPointBy": "x"
}
},
"navigator": {
"enabled": false
},
"scrollbar": {
"enabled": false
},
"rangeSelector": {
"enabled": false,
"inputEnabled": false
},
"legend": {
"enabled": null,
"maxHeight": null,
"align": "center",
"verticalAlign": "bottom",
"layout": "horizontal",
"width": null,
"margin": 12,
"reversed": false
},
"series": [
{
"name": "en1.xsmall by leafcloud",
"color": "#32f295",
"data": [
{
"x": 957.3005502261622,
"y": 961.2471908019277
},
{
"x": 961.4954137662467,
"y": 965.808030783521
},
{
"x": 970.6669676997967,
"y": 967.7982816538388
},
{
"x": 969.6383606806885,
"y": 957.9935224645658
},
{
"x": 968.8531410839885,
"y": 961.9807639791145
},
{
"x": 965.0839993417355,
"y": 967.3710521765036
},
{
"x": 972.3525274857234,
"y": 962.0687799837619
},
{
"x": 966.7087070738551,
"y": 948.4451543778008
},
{
"x": 970.0677127686226,
"y": 965.407799277998
},
{
"x": 970.769183311666,
"y": 956.1343778512851
},
{
"x": 968.3363682154054,
"y": 965.6886318368181
},
{
"x": 971.0823522617087,
"y": 942.2655421040224
},
{
"x": 972.0713307258286,
"y": 965.7004858401945
},
{
"x": 967.8711983292696,
"y": 968.2343820997235
},
{
"x": 967.8138323515034,
"y": 945.7598419058284
},
{
"x": 965.6201783736012,
"y": 945.5196422415154
},
{
"x": 953.6321516796695,
"y": 960.1175312184746
},
{
"x": 966.963060571663,
"y": 952.9063165372022
},
{
"x": 956.3068642106318,
"y": 959.2581755196525
},
{
"x": 962.2712542081024,
"y": 956.6605062265443
}
]
}
],
"drilldown": {},
"tooltip": {
"enabled": true,
"useHTML": false,
"format": null,
"headerFormat": "",
"pointFormat": "<span style=\"color:{series.color}\">Single</span>: <b>{point.x:.0f}</b><br><span style=\"color:{series.color}\">Multi</span>: <b>{point.y:.0f}</b>",
"footerFormat": "",
"shared": false,
"outside": false,
"valueDecimals": null,
"split": false
},
"annotations": null
},
"hc_type": "chart",
"id": "107514586254531240536694949157273639925"
}
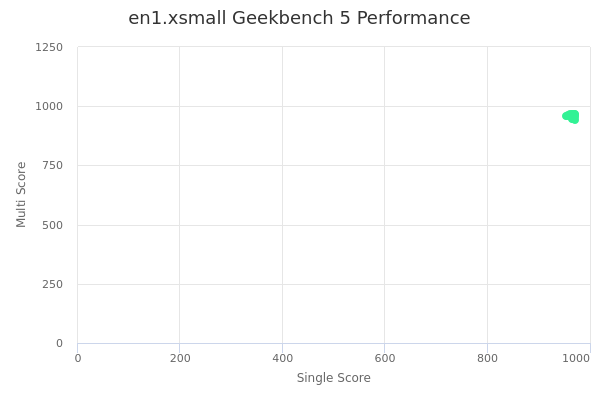
| Single | Multi | |
|---|---|---|
| Max | 972 | 968 |
| Average | 966 | 959 |
| Deviation | 5.27 | 7.86 |
| Min | 954 | 942 |
Sign up as Freemium to get more insight.
- In same series
- en1.xsmall
- en1.small
- en1.medium
- en1.large
- en1.xlarge
- en1.2xlarge
- en1.3xlarge
- en1.4xlarge
- en1.8xlarge