ec1.small by leafcloud
Geekbench is a cross-platform processor benchmark with a scoring system that determines single-core and multi-core performance using loads simulating real-world scenarios. Geekbench 5 score is calculated with a reference score of 2500 representing the performance of the Intel Core i5-2520M @ 2.50 GHz. The software benchmark is available for Mac OS, Windows, Linux, Android and iOS platforms.
Specifications:
CPU
1
RAM
2.0 GB
Root
20 GB
ec1.small Root SSD
{
"configuration": {
"chart": {
"type": "scatter",
"polar": false,
"zoomType": "",
"options3d": {},
"height": null,
"width": null,
"margin": null,
"inverted": false,
"zooming": {}
},
"credits": {
"enabled": false
},
"title": {
"text": ""
},
"colorAxis": null,
"subtitle": {
"text": ""
},
"xAxis": {
"title": {
"text": [
"Single Score"
],
"useHTML": false,
"style": {
"color": "#666666"
}
},
"categories": null,
"lineWidth": 1,
"tickInterval": null,
"tickWidth": 1,
"tickLength": 10,
"tickPixelInterval": 100,
"plotLines": null,
"labels": {
"enabled": true,
"format": null,
"formatter": "",
"style": {
"color": "#666666",
"cursor": "default",
"fontSize": "11px"
},
"useHTML": false,
"step": 0
},
"plotBands": null,
"visible": true,
"floor": null,
"ceiling": null,
"type": "linear",
"min": 0,
"gridLineWidth": 1,
"gridLineColor": "#e6e6e6",
"minorTickInterval": null,
"minorTickWidth": 0,
"minTickInterval": null,
"startOnTick": true,
"endOnTick": true,
"tickmarkPlacement": 100,
"units": 100,
"minRange": 100
},
"yAxis": {
"title": {
"text": [
"Multi Score"
],
"useHTML": false,
"style": {
"color": "#666666"
}
},
"categories": null,
"plotLines": null,
"plotBands": null,
"lineWidth": null,
"tickInterval": null,
"tickLength": 10,
"floor": null,
"ceiling": null,
"gridLineInterpolation": null,
"gridLineWidth": 1,
"gridLineColor": "#e6e6e6",
"min": 0,
"max": null,
"minorTickInterval": null,
"minorTickWidth": 0,
"minTickInterval": null,
"startOnTick": true,
"endOnTick": true,
"minRange": null,
"type": "linear",
"tickmarkPlacement": null,
"labels": {
"enabled": true,
"formatter": null,
"style": {
"color": "#666666",
"cursor": "default",
"fontSize": "11px"
},
"useHTML": false
}
},
"zAxis": {
"title": {
"text": "Multi Score"
}
},
"plotOptions": {
"series": {
"dataLabels": {
"enabled": false,
"format": null,
"distance": 30,
"align": "center",
"inside": null,
"allowOverlap": false,
"style": {
"fontSize": "11px"
}
},
"showInLegend": null,
"turboThreshold": 0,
"stacking": "",
"groupPadding": 0.2,
"centerInCategory": false,
"findNearestPointBy": "x"
}
},
"navigator": {
"enabled": false
},
"scrollbar": {
"enabled": false
},
"rangeSelector": {
"enabled": false,
"inputEnabled": false
},
"legend": {
"enabled": null,
"maxHeight": null,
"align": "center",
"verticalAlign": "bottom",
"layout": "horizontal",
"width": null,
"margin": 12,
"reversed": false
},
"series": [
{
"name": "ec1.small by leafcloud",
"color": "#32f295",
"data": [
{
"x": 930.3191159207679,
"y": 953.1234513161376
},
{
"x": 919.773693703663,
"y": 918.795780310001
},
{
"x": 968.7409801646843,
"y": 970.9955939140475
},
{
"x": 931.9681347791538,
"y": 945.792395469287
},
{
"x": 968.8302828987237,
"y": 966.4139128013126
},
{
"x": 967.8329601836354,
"y": 920.1361818432706
},
{
"x": 968.5206664911261,
"y": 957.1661546379469
},
{
"x": 967.7900037393431,
"y": 965.1062206947934
},
{
"x": 967.2260815481116,
"y": 967.1207685076286
},
{
"x": 939.2517505781592,
"y": 951.4426491056677
},
{
"x": 971.963083486042,
"y": 968.0826544208568
},
{
"x": 946.5433765302079,
"y": 932.4884252297511
},
{
"x": 970.2287703374,
"y": 968.1278383460678
},
{
"x": 972.4898572608017,
"y": 926.7214978477982
},
{
"x": 962.1358294870238,
"y": 964.5798117264139
},
{
"x": 969.7690776242746,
"y": 966.4073701110544
},
{
"x": 971.1526252890699,
"y": 968.550033420069
},
{
"x": 973.7099675905945,
"y": 951.7265345584672
},
{
"x": 967.3715692010533,
"y": 970.1608754715522
},
{
"x": 962.7570360992161,
"y": 949.6280937384163
}
]
}
],
"drilldown": {},
"tooltip": {
"enabled": true,
"useHTML": false,
"format": null,
"headerFormat": "",
"pointFormat": "<span style=\"color:{series.color}\">Single</span>: <b>{point.x:.0f}</b><br><span style=\"color:{series.color}\">Multi</span>: <b>{point.y:.0f}</b>",
"footerFormat": "",
"shared": false,
"outside": false,
"valueDecimals": null,
"split": false
},
"annotations": null
},
"hc_type": "chart",
"id": "185192489793610931568663743343469177320"
}
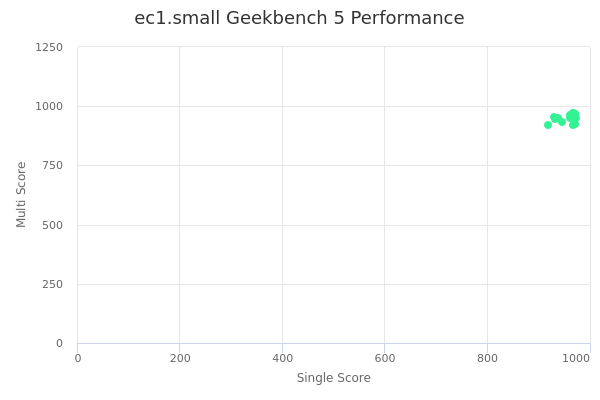
| Single | Multi | |
|---|---|---|
| Max | 974 | 971 |
| Average | 960 | 954 |
| Deviation | 16.09 | 16.70 |
| Min | 920 | 919 |
Sign up as Freemium to get more insight.
- In same series
- ec1.xsmall
- ec1.small
- ec1.medium
- ec1.large
- ec1.xlarge
- ec1.2xlarge
- ec1.3xlarge
- ec1.4xlarge
- ec1.8xlarge