ROCK-3 by Katapult
Geekbench is a cross-platform processor benchmark with a scoring system that determines single-core and multi-core performance using loads simulating real-world scenarios. Geekbench 5 score is calculated with a reference score of 2500 representing the performance of the Intel Core i5-2520M @ 2.50 GHz. The software benchmark is available for Mac OS, Windows, Linux, Android and iOS platforms.
Specifications:
CPU
1
RAM
3.0 GB
Root
25 GB
Root ROCK-3
Net
10240 Mbps
{
"configuration": {
"chart": {
"type": "scatter",
"polar": false,
"zoomType": "",
"options3d": {},
"height": null,
"width": null,
"margin": null,
"inverted": false,
"zooming": {}
},
"credits": {
"enabled": false
},
"title": {
"text": ""
},
"colorAxis": null,
"subtitle": {
"text": ""
},
"xAxis": {
"title": {
"text": [
"Single Score"
],
"useHTML": false,
"style": {
"color": "#666666"
}
},
"categories": null,
"lineWidth": 1,
"tickInterval": null,
"tickWidth": 1,
"tickLength": 10,
"tickPixelInterval": 100,
"plotLines": null,
"labels": {
"enabled": true,
"format": null,
"formatter": "",
"style": {
"color": "#666666",
"cursor": "default",
"fontSize": "11px"
},
"useHTML": false,
"step": 0
},
"plotBands": null,
"visible": true,
"floor": null,
"ceiling": null,
"type": "linear",
"min": 0,
"gridLineWidth": 1,
"gridLineColor": "#e6e6e6",
"minorTickInterval": null,
"minorTickWidth": 0,
"minTickInterval": null,
"startOnTick": true,
"endOnTick": true,
"tickmarkPlacement": 100,
"units": 100,
"minRange": 100
},
"yAxis": {
"title": {
"text": [
"Multi Score"
],
"useHTML": false,
"style": {
"color": "#666666"
}
},
"categories": null,
"plotLines": null,
"plotBands": null,
"lineWidth": null,
"tickInterval": null,
"tickLength": 10,
"floor": null,
"ceiling": null,
"gridLineInterpolation": null,
"gridLineWidth": 1,
"gridLineColor": "#e6e6e6",
"min": 0,
"max": null,
"minorTickInterval": null,
"minorTickWidth": 0,
"minTickInterval": null,
"startOnTick": true,
"endOnTick": true,
"minRange": null,
"type": "linear",
"tickmarkPlacement": null,
"labels": {
"enabled": true,
"formatter": null,
"style": {
"color": "#666666",
"cursor": "default",
"fontSize": "11px"
},
"useHTML": false
}
},
"zAxis": {
"title": {
"text": "Multi Score"
}
},
"plotOptions": {
"series": {
"dataLabels": {
"enabled": false,
"format": null,
"distance": 30,
"align": "center",
"inside": null,
"allowOverlap": false,
"style": {
"fontSize": "11px"
}
},
"showInLegend": null,
"turboThreshold": 0,
"stacking": "",
"groupPadding": 0.2,
"centerInCategory": false,
"findNearestPointBy": "x"
}
},
"navigator": {
"enabled": false
},
"scrollbar": {
"enabled": false
},
"rangeSelector": {
"enabled": false,
"inputEnabled": false
},
"legend": {
"enabled": null,
"maxHeight": null,
"align": "center",
"verticalAlign": "bottom",
"layout": "horizontal",
"width": null,
"margin": 12,
"reversed": false
},
"series": [
{
"name": "ROCK-3 by Katapult",
"color": "#2a88db",
"data": [
{
"x": 987.3920571364187,
"y": 987.174963697048
},
{
"x": 985.8545338776646,
"y": 985.5176808723392
},
{
"x": 987.8886632260349,
"y": 986.4669853848359
},
{
"x": 983.3160605775802,
"y": 983.4728288715573
},
{
"x": 984.2456146537179,
"y": 985.4683785084464
},
{
"x": 984.6074192908851,
"y": 985.6470379628889
},
{
"x": 987.342548712448,
"y": 988.52609489311
},
{
"x": 985.5958648595193,
"y": 964.4373228362026
},
{
"x": 985.724798304954,
"y": 975.9792721829219
},
{
"x": 981.6751889196908,
"y": 986.3205815509161
},
{
"x": 985.4157382021989,
"y": 983.6347706482825
},
{
"x": 981.3595054241096,
"y": 984.7231992926368
},
{
"x": 983.8140472662801,
"y": 984.8903482523947
},
{
"x": 988.5156428555536,
"y": 987.0280323934503
},
{
"x": 984.2312364094762,
"y": 981.5818774765285
},
{
"x": 988.286771575174,
"y": 989.7488591538247
},
{
"x": 990.327937147521,
"y": 989.2969916684787
},
{
"x": 989.7242358924614,
"y": 980.9340874754033
},
{
"x": 984.9486115694585,
"y": 987.5198279214276
},
{
"x": 981.4135861775376,
"y": 974.2611149045522
},
{
"x": 985.3747717797676,
"y": 982.1405178140651
},
{
"x": 983.8985025004793,
"y": 979.4995748671942
},
{
"x": 983.2869144516433,
"y": 986.698650292996
},
{
"x": 981.4012581903031,
"y": 977.6199234942942
},
{
"x": 989.1058265034058,
"y": 987.8906976279618
},
{
"x": 984.7378728409562,
"y": 975.4477398178417
},
{
"x": 990.7047925395418,
"y": 994.119645550044
},
{
"x": 978.3215418543639,
"y": 980.8425804787522
},
{
"x": 982.2107852031379,
"y": 959.0455979012825
},
{
"x": 976.947648372952,
"y": 983.611779158741
},
{
"x": 988.0321283624404,
"y": 988.9466352735485
},
{
"x": 984.5509328403994,
"y": 976.4968367836118
},
{
"x": 986.0288355352889,
"y": 985.9343710891112
},
{
"x": 983.9878318686144,
"y": 981.6767509928936
},
{
"x": 978.772538142897,
"y": 983.1486161476398
},
{
"x": 982.6287009462194,
"y": 988.1481026817111
},
{
"x": 983.662368038267,
"y": 988.2023633019334
},
{
"x": 985.5381463696069,
"y": 981.2363035628559
},
{
"x": 982.4032087111491,
"y": 978.5208733190864
},
{
"x": 983.8278867443116,
"y": 977.3473171056517
},
{
"x": 979.7902608851628,
"y": 984.8753054654073
},
{
"x": 976.1543531500977,
"y": 977.079507542044
},
{
"x": 983.3651896201059,
"y": 986.6844553653896
},
{
"x": 986.6077324003229,
"y": 986.067558686806
},
{
"x": 983.9752914456536,
"y": 985.8963888357105
},
{
"x": 987.6276973764616,
"y": 982.6889042957955
},
{
"x": 982.2444796848708,
"y": 982.7324230364575
},
{
"x": 989.4669321079245,
"y": 985.0685761932187
},
{
"x": 975.8842269932791,
"y": 985.5420635364142
},
{
"x": 982.788129361333,
"y": 978.9708527106604
}
]
}
],
"drilldown": {},
"tooltip": {
"enabled": true,
"useHTML": false,
"format": null,
"headerFormat": "",
"pointFormat": "<span style=\"color:{series.color}\">Single</span>: <b>{point.x:.0f}</b><br><span style=\"color:{series.color}\">Multi</span>: <b>{point.y:.0f}</b>",
"footerFormat": "",
"shared": false,
"outside": false,
"valueDecimals": null,
"split": false
},
"annotations": null
},
"hc_type": "chart",
"id": "201238737050942674846174409389823495528"
}
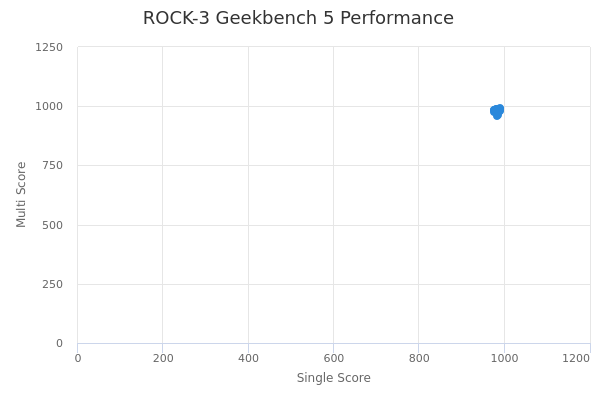
| Single | Multi | |
|---|---|---|
| Max | 991 | 994 |
| Average | 984 | 983 |
| Deviation | 3.46 | 6.05 |
| Min | 976 | 959 |