vx2d-16x224 by IBM Cloud
Geekbench is a cross-platform processor benchmark with a scoring system that determines single-core and multi-core performance using loads simulating real-world scenarios. Geekbench 5 score is calculated with a reference score of 2500 representing the performance of the Intel Core i5-2520M @ 2.50 GHz. The software benchmark is available for Mac OS, Windows, Linux, Android and iOS platforms.
Specifications:
CPU
16
RAM
240.0 GB
Extra
1x
480 GB
SSD
{
"configuration": {
"chart": {
"type": "scatter",
"polar": false,
"zoomType": "",
"options3d": {},
"height": null,
"width": null,
"margin": null,
"inverted": false,
"zooming": {}
},
"credits": {
"enabled": false
},
"title": {
"text": ""
},
"colorAxis": null,
"subtitle": {
"text": ""
},
"xAxis": {
"title": {
"text": [
"Single Score"
],
"useHTML": false,
"style": {
"color": "#666666"
}
},
"categories": null,
"lineWidth": 1,
"tickInterval": null,
"tickWidth": 1,
"tickLength": 10,
"tickPixelInterval": 100,
"plotLines": null,
"labels": {
"enabled": true,
"format": null,
"formatter": "",
"style": {
"color": "#666666",
"cursor": "default",
"fontSize": "11px"
},
"useHTML": false,
"step": 0
},
"plotBands": null,
"visible": true,
"floor": null,
"ceiling": null,
"type": "linear",
"min": 0,
"gridLineWidth": 1,
"gridLineColor": "#e6e6e6",
"minorTickInterval": null,
"minorTickWidth": 0,
"minTickInterval": null,
"startOnTick": true,
"endOnTick": true,
"tickmarkPlacement": 100,
"units": 100,
"minRange": 100
},
"yAxis": {
"title": {
"text": [
"Multi Score"
],
"useHTML": false,
"style": {
"color": "#666666"
}
},
"categories": null,
"plotLines": null,
"plotBands": null,
"lineWidth": null,
"tickInterval": null,
"tickLength": 10,
"floor": null,
"ceiling": null,
"gridLineInterpolation": null,
"gridLineWidth": 1,
"gridLineColor": "#e6e6e6",
"min": 0,
"max": null,
"minorTickInterval": null,
"minorTickWidth": 0,
"minTickInterval": null,
"startOnTick": true,
"endOnTick": true,
"minRange": null,
"type": "linear",
"tickmarkPlacement": null,
"labels": {
"enabled": true,
"formatter": null,
"style": {
"color": "#666666",
"cursor": "default",
"fontSize": "11px"
},
"useHTML": false
}
},
"zAxis": {
"title": {
"text": "Multi Score"
}
},
"plotOptions": {
"series": {
"dataLabels": {
"enabled": false,
"format": null,
"distance": 30,
"align": "center",
"inside": null,
"allowOverlap": false,
"style": {
"fontSize": "11px"
}
},
"showInLegend": null,
"turboThreshold": 0,
"stacking": "",
"groupPadding": 0.2,
"centerInCategory": false,
"findNearestPointBy": "x"
}
},
"navigator": {
"enabled": false
},
"scrollbar": {
"enabled": false
},
"rangeSelector": {
"enabled": false,
"inputEnabled": false
},
"legend": {
"enabled": null,
"maxHeight": null,
"align": "center",
"verticalAlign": "bottom",
"layout": "horizontal",
"width": null,
"margin": 12,
"reversed": false
},
"series": [
{
"name": "vx2d-16x224 by IBM Cloud",
"color": "#152935",
"data": [
{
"x": 1012.5918139113686,
"y": 8632.531603277474
},
{
"x": 979.7036229744865,
"y": 7470.941596939243
},
{
"x": 1012.7716295193426,
"y": 8658.483040233792
},
{
"x": 977.8038440436992,
"y": 7458.3984687342945
},
{
"x": 1008.4564245336301,
"y": 8684.598064782815
},
{
"x": 974.4259712426319,
"y": 7540.846902180415
},
{
"x": 1001.9511459928844,
"y": 8661.473482701265
},
{
"x": 969.15909435339,
"y": 7349.674979755891
},
{
"x": 1009.8513049697449,
"y": 8660.599920601117
},
{
"x": 971.6094282575402,
"y": 7489.224703218966
},
{
"x": 993.201155902565,
"y": 8661.231521153422
},
{
"x": 968.2682753760828,
"y": 7343.242713506306
},
{
"x": 1006.0401701514979,
"y": 8660.45016713029
},
{
"x": 971.7546804646578,
"y": 7272.15842466002
},
{
"x": 1011.5829667861633,
"y": 8653.546438873336
},
{
"x": 964.4752980531603,
"y": 7291.694162239937
},
{
"x": 1009.5103057839378,
"y": 8676.206484507302
},
{
"x": 996.4877186263279,
"y": 8606.634313639348
},
{
"x": 1010.5542538109746,
"y": 8663.176042419396
},
{
"x": 997.287247534628,
"y": 8650.820589043584
}
]
}
],
"drilldown": {},
"tooltip": {
"enabled": true,
"useHTML": false,
"format": null,
"headerFormat": "",
"pointFormat": "<span style=\"color:{series.color}\">Single</span>: <b>{point.x:.0f}</b><br><span style=\"color:{series.color}\">Multi</span>: <b>{point.y:.0f}</b>",
"footerFormat": "",
"shared": false,
"outside": false,
"valueDecimals": null,
"split": false
},
"annotations": null
},
"hc_type": "chart",
"id": "312170101438875410764184746472379380880"
}
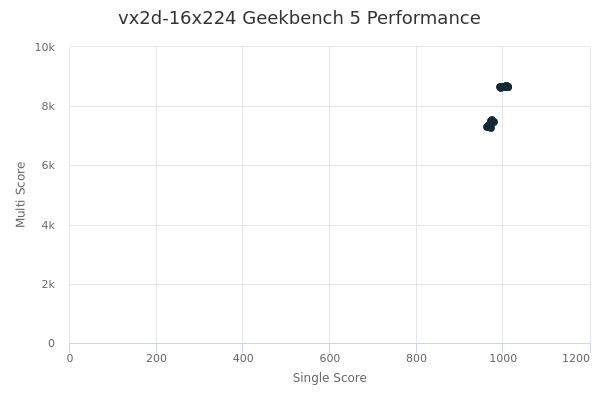
| Single | Multi | |
|---|---|---|
| Max | 1013 | 8685 |
| Average | 992 | 8154 |
| Deviation | 17.54 | 617.25 |
| Min | 964 | 7272 |
Sign up as Freemium to get more insight.
- In same series
- vx2d-2x28
- vx2d-4x56
- vx2d-8x112
- vx2d-16x224
- vx2d-44x616
- vx2d-88x1232
- vx2d-144x2016
- vx2d-176x2464