bx2-32x128 by IBM Cloud
Geekbench is a cross-platform processor benchmark with a scoring system that determines single-core and multi-core performance using loads simulating real-world scenarios. Geekbench 5 score is calculated with a reference score of 2500 representing the performance of the Intel Core i5-2520M @ 2.50 GHz. The software benchmark is available for Mac OS, Windows, Linux, Android and iOS platforms.
Specifications:
CPU
32
RAM
138.0 GB
Net
64000 Mbps
{
"configuration": {
"chart": {
"type": "scatter",
"polar": false,
"zoomType": "",
"options3d": {},
"height": null,
"width": null,
"margin": null,
"inverted": false,
"zooming": {}
},
"credits": {
"enabled": false
},
"title": {
"text": ""
},
"colorAxis": null,
"subtitle": {
"text": ""
},
"xAxis": {
"title": {
"text": [
"Single Score"
],
"useHTML": false,
"style": {
"color": "#666666"
}
},
"categories": null,
"lineWidth": 1,
"tickInterval": null,
"tickWidth": 1,
"tickLength": 10,
"tickPixelInterval": 100,
"plotLines": null,
"labels": {
"enabled": true,
"format": null,
"formatter": "",
"style": {
"color": "#666666",
"cursor": "default",
"fontSize": "11px"
},
"useHTML": false,
"step": 0
},
"plotBands": null,
"visible": true,
"floor": null,
"ceiling": null,
"type": "linear",
"min": 0,
"gridLineWidth": 1,
"gridLineColor": "#e6e6e6",
"minorTickInterval": null,
"minorTickWidth": 0,
"minTickInterval": null,
"startOnTick": true,
"endOnTick": true,
"tickmarkPlacement": 100,
"units": 100,
"minRange": 100
},
"yAxis": {
"title": {
"text": [
"Multi Score"
],
"useHTML": false,
"style": {
"color": "#666666"
}
},
"categories": null,
"plotLines": null,
"plotBands": null,
"lineWidth": null,
"tickInterval": null,
"tickLength": 10,
"floor": null,
"ceiling": null,
"gridLineInterpolation": null,
"gridLineWidth": 1,
"gridLineColor": "#e6e6e6",
"min": 0,
"max": null,
"minorTickInterval": null,
"minorTickWidth": 0,
"minTickInterval": null,
"startOnTick": true,
"endOnTick": true,
"minRange": null,
"type": "linear",
"tickmarkPlacement": null,
"labels": {
"enabled": true,
"formatter": null,
"style": {
"color": "#666666",
"cursor": "default",
"fontSize": "11px"
},
"useHTML": false
}
},
"zAxis": {
"title": {
"text": "Multi Score"
}
},
"plotOptions": {
"series": {
"dataLabels": {
"enabled": false,
"format": null,
"distance": 30,
"align": "center",
"inside": null,
"allowOverlap": false,
"style": {
"fontSize": "11px"
}
},
"showInLegend": null,
"turboThreshold": 0,
"stacking": "",
"groupPadding": 0.2,
"centerInCategory": false,
"findNearestPointBy": "x"
}
},
"navigator": {
"enabled": false
},
"scrollbar": {
"enabled": false
},
"rangeSelector": {
"enabled": false,
"inputEnabled": false
},
"legend": {
"enabled": null,
"maxHeight": null,
"align": "center",
"verticalAlign": "bottom",
"layout": "horizontal",
"width": null,
"margin": 12,
"reversed": false
},
"series": [
{
"name": "bx2-32x128 by IBM Cloud",
"color": "#152935",
"data": [
{
"x": 1047.3215258345192,
"y": 14200.371857526221
},
{
"x": 991.6031433755647,
"y": 14225.440203600108
},
{
"x": 1040.1437897256183,
"y": 14253.598817901395
},
{
"x": 991.9058512277506,
"y": 14198.94645963855
},
{
"x": 1046.2262909298884,
"y": 14260.518354941676
},
{
"x": 988.6075656649721,
"y": 14231.709347955373
},
{
"x": 1050.3704581424893,
"y": 14227.216233825606
},
{
"x": 993.9690356911216,
"y": 14222.843514889615
},
{
"x": 1049.9053257960081,
"y": 14261.009253335118
},
{
"x": 972.9556766135166,
"y": 14159.521304194363
},
{
"x": 969.154394693646,
"y": 15503.459415050693
},
{
"x": 922.0493557675313,
"y": 14019.146303189378
},
{
"x": 969.1607089697619,
"y": 15400.762498587086
},
{
"x": 926.7108702475658,
"y": 14347.411368179677
},
{
"x": 968.9221002064256,
"y": 15327.872672514537
},
{
"x": 921.558207636517,
"y": 14439.112576095707
}
]
}
],
"drilldown": {},
"tooltip": {
"enabled": true,
"useHTML": false,
"format": null,
"headerFormat": "",
"pointFormat": "<span style=\"color:{series.color}\">Single</span>: <b>{point.x:.0f}</b><br><span style=\"color:{series.color}\">Multi</span>: <b>{point.y:.0f}</b>",
"footerFormat": "",
"shared": false,
"outside": false,
"valueDecimals": null,
"split": false
},
"annotations": null
},
"hc_type": "chart",
"id": "146832972182341609039644681298437797275"
}
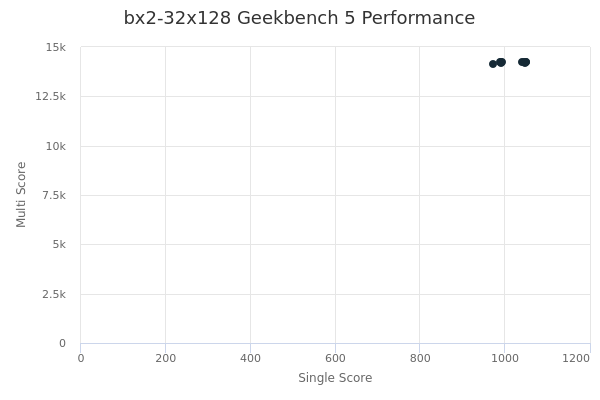
| Single | Multi | |
|---|---|---|
| Max | 1050 | 15503 |
| Average | 991 | 14455 |
| Deviation | 44.10 | 467.67 |
| Min | 922 | 14019 |
Sign up as Freemium to get more insight.
- In same series
- bx2-2x8
- bx2-4x16
- bx2-8x32
- bx2-16x64
- bx2-32x128
- bx2-48x192
- bx2-64x256
- bx2-96x384
- bx2-128x512