CCX22 by Hetzner
Geekbench is a cross-platform processor benchmark with a scoring system that determines single-core and multi-core performance using loads simulating real-world scenarios. Geekbench 5 score is calculated with a reference score of 2500 representing the performance of the Intel Core i5-2520M @ 2.50 GHz. The software benchmark is available for Mac OS, Windows, Linux, Android and iOS platforms.
Specifications:
CPU
4
RAM
16.0 GB
Root
160 GB
ccx22 Local
{
"configuration": {
"chart": {
"type": "scatter",
"polar": false,
"zoomType": "",
"options3d": {},
"height": null,
"width": null,
"margin": null,
"inverted": false,
"zooming": {}
},
"credits": {
"enabled": false
},
"title": {
"text": ""
},
"colorAxis": null,
"subtitle": {
"text": ""
},
"xAxis": {
"title": {
"text": [
"Single Score"
],
"useHTML": false,
"style": {
"color": "#666666"
}
},
"categories": null,
"lineWidth": 1,
"tickInterval": null,
"tickWidth": 1,
"tickLength": 10,
"tickPixelInterval": 100,
"plotLines": null,
"labels": {
"enabled": true,
"format": null,
"formatter": "",
"style": {
"color": "#666666",
"cursor": "default",
"fontSize": "11px"
},
"useHTML": false,
"step": 0
},
"plotBands": null,
"visible": true,
"floor": null,
"ceiling": null,
"type": "linear",
"min": 0,
"gridLineWidth": 1,
"gridLineColor": "#e6e6e6",
"minorTickInterval": null,
"minorTickWidth": 0,
"minTickInterval": null,
"startOnTick": true,
"endOnTick": true,
"tickmarkPlacement": 100,
"units": 100,
"minRange": 100
},
"yAxis": {
"title": {
"text": [
"Multi Score"
],
"useHTML": false,
"style": {
"color": "#666666"
}
},
"categories": null,
"plotLines": null,
"plotBands": null,
"lineWidth": null,
"tickInterval": null,
"tickLength": 10,
"floor": null,
"ceiling": null,
"gridLineInterpolation": null,
"gridLineWidth": 1,
"gridLineColor": "#e6e6e6",
"min": 0,
"max": null,
"minorTickInterval": null,
"minorTickWidth": 0,
"minTickInterval": null,
"startOnTick": true,
"endOnTick": true,
"minRange": null,
"type": "linear",
"tickmarkPlacement": null,
"labels": {
"enabled": true,
"formatter": null,
"style": {
"color": "#666666",
"cursor": "default",
"fontSize": "11px"
},
"useHTML": false
}
},
"zAxis": {
"title": {
"text": "Multi Score"
}
},
"plotOptions": {
"series": {
"dataLabels": {
"enabled": false,
"format": null,
"distance": 30,
"align": "center",
"inside": null,
"allowOverlap": false,
"style": {
"fontSize": "11px"
}
},
"showInLegend": null,
"turboThreshold": 0,
"stacking": "",
"groupPadding": 0.2,
"centerInCategory": false,
"findNearestPointBy": "x"
}
},
"navigator": {
"enabled": false
},
"scrollbar": {
"enabled": false
},
"rangeSelector": {
"enabled": false,
"inputEnabled": false
},
"legend": {
"enabled": null,
"maxHeight": null,
"align": "center",
"verticalAlign": "bottom",
"layout": "horizontal",
"width": null,
"margin": 12,
"reversed": false
},
"series": [
{
"name": "CCX22 by Hetzner",
"color": "#d5092d",
"data": [
{
"x": 988.6887648497152,
"y": 2559.036270429694
},
{
"x": 993.141578813258,
"y": 2568.2072730049267
},
{
"x": 994.471546604851,
"y": 2556.3639168493523
},
{
"x": 996.0200051396653,
"y": 2567.2098501273795
},
{
"x": 993.7590779042522,
"y": 2558.1925246054334
},
{
"x": 991.0132115269247,
"y": 2578.512594592946
},
{
"x": 993.7055541429171,
"y": 2565.228778369486
},
{
"x": 994.1490507157641,
"y": 2574.5593214705855
},
{
"x": 991.5611144728182,
"y": 2563.056828522928
},
{
"x": 998.34423368408,
"y": 2560.6973539697965
},
{
"x": 994.882840003634,
"y": 2582.5405876834657
},
{
"x": 1001.0449174693113,
"y": 2579.448486927954
},
{
"x": 993.2471081060309,
"y": 2573.234790513301
},
{
"x": 995.3633436589855,
"y": 2559.8088718035165
},
{
"x": 995.5920535651717,
"y": 2563.499195193692
},
{
"x": 991.9529945729589,
"y": 2572.790492018004
},
{
"x": 992.4177866349157,
"y": 2572.689864269362
},
{
"x": 992.5381676751903,
"y": 2573.7523635136104
},
{
"x": 993.6212883925255,
"y": 2556.5033258751237
},
{
"x": 994.1559387321897,
"y": 2559.8009426547196
}
]
}
],
"drilldown": {},
"tooltip": {
"enabled": true,
"useHTML": false,
"format": null,
"headerFormat": "",
"pointFormat": "<span style=\"color:{series.color}\">Single</span>: <b>{point.x:.0f}</b><br><span style=\"color:{series.color}\">Multi</span>: <b>{point.y:.0f}</b>",
"footerFormat": "",
"shared": false,
"outside": false,
"valueDecimals": null,
"split": false
},
"annotations": null
},
"hc_type": "chart",
"id": "308102916118452768079654826161604326269"
}
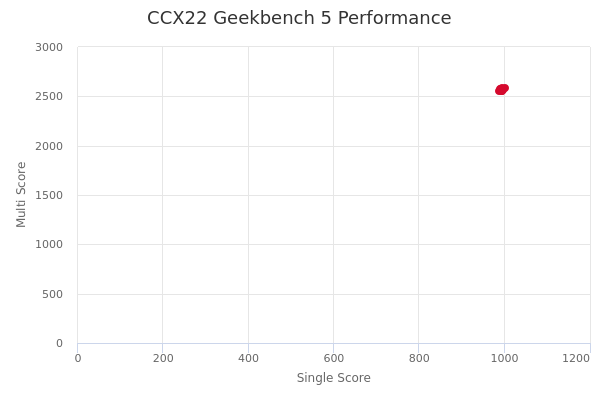
| Single | Multi | |
|---|---|---|
| Max | 1001 | 2583 |
| Average | 994 | 2567 |
| Deviation | 2.56 | 7.99 |
| Min | 989 | 2556 |