n2d-highmem-2 AMD Rome by Google Cloud
Geekbench is a cross-platform processor benchmark with a scoring system that determines single-core and multi-core performance using loads simulating real-world scenarios. Geekbench 5 score is calculated with a reference score of 2500 representing the performance of the Intel Core i5-2520M @ 2.50 GHz. The software benchmark is available for Mac OS, Windows, Linux, Android and iOS platforms.
Specifications:
CPU
2
RAM
16.0 GB
{
"configuration": {
"chart": {
"type": "scatter",
"polar": false,
"zoomType": "",
"options3d": {},
"height": null,
"width": null,
"margin": null,
"inverted": false,
"zooming": {}
},
"credits": {
"enabled": false
},
"title": {
"text": ""
},
"colorAxis": null,
"subtitle": {
"text": ""
},
"xAxis": {
"title": {
"text": [
"Single Score"
],
"useHTML": false,
"style": {
"color": "#666666"
}
},
"categories": null,
"lineWidth": 1,
"tickInterval": null,
"tickWidth": 1,
"tickLength": 10,
"tickPixelInterval": 100,
"plotLines": null,
"labels": {
"enabled": true,
"format": null,
"formatter": "",
"style": {
"color": "#666666",
"cursor": "default",
"fontSize": "11px"
},
"useHTML": false,
"step": 0
},
"plotBands": null,
"visible": true,
"floor": null,
"ceiling": null,
"type": "linear",
"min": 0,
"gridLineWidth": 1,
"gridLineColor": "#e6e6e6",
"minorTickInterval": null,
"minorTickWidth": 0,
"minTickInterval": null,
"startOnTick": true,
"endOnTick": true,
"tickmarkPlacement": 100,
"units": 100,
"minRange": 100
},
"yAxis": {
"title": {
"text": [
"Multi Score"
],
"useHTML": false,
"style": {
"color": "#666666"
}
},
"categories": null,
"plotLines": null,
"plotBands": null,
"lineWidth": null,
"tickInterval": null,
"tickLength": 10,
"floor": null,
"ceiling": null,
"gridLineInterpolation": null,
"gridLineWidth": 1,
"gridLineColor": "#e6e6e6",
"min": 0,
"max": null,
"minorTickInterval": null,
"minorTickWidth": 0,
"minTickInterval": null,
"startOnTick": true,
"endOnTick": true,
"minRange": null,
"type": "linear",
"tickmarkPlacement": null,
"labels": {
"enabled": true,
"formatter": null,
"style": {
"color": "#666666",
"cursor": "default",
"fontSize": "11px"
},
"useHTML": false
}
},
"zAxis": {
"title": {
"text": "Multi Score"
}
},
"plotOptions": {
"series": {
"dataLabels": {
"enabled": false,
"format": null,
"distance": 30,
"align": "center",
"inside": null,
"allowOverlap": false,
"style": {
"fontSize": "11px"
}
},
"showInLegend": null,
"turboThreshold": 0,
"stacking": "",
"groupPadding": 0.2,
"centerInCategory": false,
"findNearestPointBy": "x"
}
},
"navigator": {
"enabled": false
},
"scrollbar": {
"enabled": false
},
"rangeSelector": {
"enabled": false,
"inputEnabled": false
},
"legend": {
"enabled": null,
"maxHeight": null,
"align": "center",
"verticalAlign": "bottom",
"layout": "horizontal",
"width": null,
"margin": 12,
"reversed": false
},
"series": [
{
"name": "n2d-highmem-2 AMD Rome by Google Cloud",
"color": "#55b400",
"data": [
{
"x": 720.4589010227687,
"y": 1068.6739174313566
},
{
"x": 618.6684774356384,
"y": 1019.8165040848303
},
{
"x": 750.435721772924,
"y": 1070.1311929442509
},
{
"x": 706.1285592405827,
"y": 1019.3991882506464
},
{
"x": 736.5952676781137,
"y": 1049.4344927882757
},
{
"x": 714.475851531934,
"y": 1010.802693138948
},
{
"x": 755.619404385382,
"y": 1068.5594127576826
},
{
"x": 704.8861771717321,
"y": 1027.9835538763953
},
{
"x": 739.943856093546,
"y": 1040.2877578594912
},
{
"x": 723.4772713874173,
"y": 1025.2023037903796
},
{
"x": 779.0237826751187,
"y": 1098.7560923006067
},
{
"x": 752.4026334329421,
"y": 1073.0932206809148
},
{
"x": 806.5679987719864,
"y": 1098.9493413216344
},
{
"x": 751.1864965291257,
"y": 1073.325361293967
},
{
"x": 751.1875102740503,
"y": 1097.1947595833653
},
{
"x": 754.9130550614633,
"y": 1080.5941497216227
},
{
"x": 865.8005155144031,
"y": 1098.2373178825183
},
{
"x": 756.021845779476,
"y": 1073.9274778904396
},
{
"x": 817.5120800646368,
"y": 1099.8194312983237
},
{
"x": 752.097033211453,
"y": 1075.703384373052
}
]
}
],
"drilldown": {},
"tooltip": {
"enabled": true,
"useHTML": false,
"format": null,
"headerFormat": "",
"pointFormat": "<span style=\"color:{series.color}\">Single</span>: <b>{point.x:.0f}</b><br><span style=\"color:{series.color}\">Multi</span>: <b>{point.y:.0f}</b>",
"footerFormat": "",
"shared": false,
"outside": false,
"valueDecimals": null,
"split": false
},
"annotations": null
},
"hc_type": "chart",
"id": "340158646842685435010192439231788157022"
}
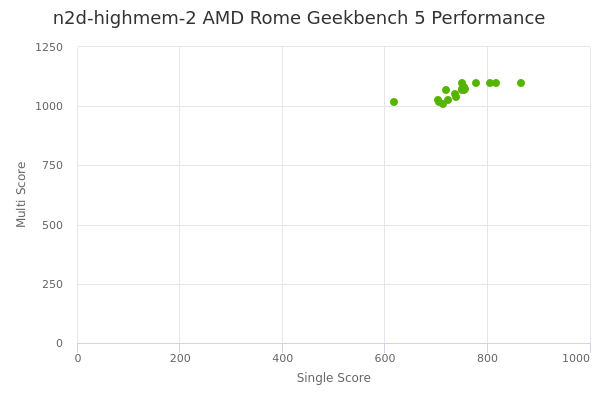
| Single | Multi | |
|---|---|---|
| Max | 866 | 1100 |
| Average | 748 | 1063 |
| Deviation | 48.14 | 29.23 |
| Min | 619 | 1011 |
Sign up as Freemium to get more insight.