Custom N2D 4 vCPU 8GB AMD Rome by Google Cloud
Geekbench is a cross-platform processor benchmark with a scoring system that determines single-core and multi-core performance using loads simulating real-world scenarios. Geekbench 5 score is calculated with a reference score of 2500 representing the performance of the Intel Core i5-2520M @ 2.50 GHz. The software benchmark is available for Mac OS, Windows, Linux, Android and iOS platforms.
Specifications:
CPU
4
RAM
8.0 GB
{
"configuration": {
"chart": {
"type": "scatter",
"polar": false,
"zoomType": "",
"options3d": {},
"height": null,
"width": null,
"margin": null,
"inverted": false,
"zooming": {}
},
"credits": {
"enabled": false
},
"title": {
"text": ""
},
"colorAxis": null,
"subtitle": {
"text": ""
},
"xAxis": {
"title": {
"text": [
"Single Score"
],
"useHTML": false,
"style": {
"color": "#666666"
}
},
"categories": null,
"lineWidth": 1,
"tickInterval": null,
"tickWidth": 1,
"tickLength": 10,
"tickPixelInterval": 100,
"plotLines": null,
"labels": {
"enabled": true,
"format": null,
"formatter": "",
"style": {
"color": "#666666",
"cursor": "default",
"fontSize": "11px"
},
"useHTML": false,
"step": 0
},
"plotBands": null,
"visible": true,
"floor": null,
"ceiling": null,
"type": "linear",
"min": 0,
"gridLineWidth": 1,
"gridLineColor": "#e6e6e6",
"minorTickInterval": null,
"minorTickWidth": 0,
"minTickInterval": null,
"startOnTick": true,
"endOnTick": true,
"tickmarkPlacement": 100,
"units": 100,
"minRange": 100
},
"yAxis": {
"title": {
"text": [
"Multi Score"
],
"useHTML": false,
"style": {
"color": "#666666"
}
},
"categories": null,
"plotLines": null,
"plotBands": null,
"lineWidth": null,
"tickInterval": null,
"tickLength": 10,
"floor": null,
"ceiling": null,
"gridLineInterpolation": null,
"gridLineWidth": 1,
"gridLineColor": "#e6e6e6",
"min": 0,
"max": null,
"minorTickInterval": null,
"minorTickWidth": 0,
"minTickInterval": null,
"startOnTick": true,
"endOnTick": true,
"minRange": null,
"type": "linear",
"tickmarkPlacement": null,
"labels": {
"enabled": true,
"formatter": null,
"style": {
"color": "#666666",
"cursor": "default",
"fontSize": "11px"
},
"useHTML": false
}
},
"zAxis": {
"title": {
"text": "Multi Score"
}
},
"plotOptions": {
"series": {
"dataLabels": {
"enabled": false,
"format": null,
"distance": 30,
"align": "center",
"inside": null,
"allowOverlap": false,
"style": {
"fontSize": "11px"
}
},
"showInLegend": null,
"turboThreshold": 0,
"stacking": "",
"groupPadding": 0.2,
"centerInCategory": false,
"findNearestPointBy": "x"
}
},
"navigator": {
"enabled": false
},
"scrollbar": {
"enabled": false
},
"rangeSelector": {
"enabled": false,
"inputEnabled": false
},
"legend": {
"enabled": null,
"maxHeight": null,
"align": "center",
"verticalAlign": "bottom",
"layout": "horizontal",
"width": null,
"margin": 12,
"reversed": false
},
"series": [
{
"name": "Custom N2D 4 vCPU 8GB AMD Rome by Google Cloud",
"color": "#55b400",
"data": [
{
"x": 889.2846052838,
"y": 2235.6301633463136
},
{
"x": 797.6015403519347,
"y": 2184.411042141378
},
{
"x": 831.2976837834095,
"y": 2228.276912596012
},
{
"x": 856.7270660290108,
"y": 2183.097564333386
},
{
"x": 884.834683144518,
"y": 2225.6064108305263
},
{
"x": 782.5871022891938,
"y": 2186.075201037841
},
{
"x": 858.7264969531861,
"y": 2231.1797715978664
},
{
"x": 781.0065924479632,
"y": 2177.616477621273
},
{
"x": 894.4568522722996,
"y": 2225.0489287936125
},
{
"x": 931.3042692197741,
"y": 2178.094904036363
},
{
"x": 893.6146917901398,
"y": 2224.825882683471
},
{
"x": 927.9075653105186,
"y": 2175.884902379028
},
{
"x": 961.2023115200052,
"y": 2220.980050501173
},
{
"x": 851.3219772840409,
"y": 2181.90455177847
},
{
"x": 872.0619872166741,
"y": 2219.0308918489054
},
{
"x": 851.3782879775243,
"y": 2181.31341347489
},
{
"x": 941.9799775615379,
"y": 2219.1968367058275
},
{
"x": 782.0952193168183,
"y": 2181.2257173708217
},
{
"x": 840.7978970231752,
"y": 2217.4233601313113
},
{
"x": 878.9387958657226,
"y": 2176.041190378224
},
{
"x": 788.4794629615648,
"y": 2161.579544468561
},
{
"x": 818.3290334784315,
"y": 2154.7895202976592
},
{
"x": 808.8161887246996,
"y": 2142.4263439241736
},
{
"x": 752.9754470781397,
"y": 2145.5026729070637
},
{
"x": 892.8530074003513,
"y": 2146.7037077064965
},
{
"x": 773.1701788320315,
"y": 2156.1121897116473
},
{
"x": 753.2437219093883,
"y": 2147.908422309346
},
{
"x": 763.5711220622701,
"y": 2142.980484922828
},
{
"x": 752.6660104385749,
"y": 2155.7580686565566
},
{
"x": 752.9302518121194,
"y": 2160.6555133972024
},
{
"x": 750.9725300868874,
"y": 2150.631544719313
},
{
"x": 759.6299964458824,
"y": 2147.891431302922
},
{
"x": 822.515359996659,
"y": 2151.886419301488
},
{
"x": 819.6738962914171,
"y": 2149.024349816277
},
{
"x": 913.5995632217844,
"y": 2160.2610421629574
},
{
"x": 786.9943600575575,
"y": 2155.538736216891
},
{
"x": 755.6709589931374,
"y": 2144.730867250211
},
{
"x": 755.4545274610415,
"y": 2147.9941025688995
},
{
"x": 749.7486025251862,
"y": 2150.064252833955
},
{
"x": 755.7752603962767,
"y": 2143.3308590250617
},
{
"x": 1125.7497283104108,
"y": 2756.6961732111076
},
{
"x": 1113.2990119002916,
"y": 2743.013385976318
},
{
"x": 1118.7744947356662,
"y": 2747.0114573264277
},
{
"x": 1110.2707449855757,
"y": 2738.018790881966
},
{
"x": 1123.004638271913,
"y": 2758.9382690431985
},
{
"x": 1104.3638125207942,
"y": 2730.0511196234575
}
]
}
],
"drilldown": {},
"tooltip": {
"enabled": true,
"useHTML": false,
"format": null,
"headerFormat": "",
"pointFormat": "<span style=\"color:{series.color}\">Single</span>: <b>{point.x:.0f}</b><br><span style=\"color:{series.color}\">Multi</span>: <b>{point.y:.0f}</b>",
"footerFormat": "",
"shared": false,
"outside": false,
"valueDecimals": null,
"split": false
},
"annotations": null
},
"hc_type": "chart",
"id": "9280101064631309783565293470854193900"
}
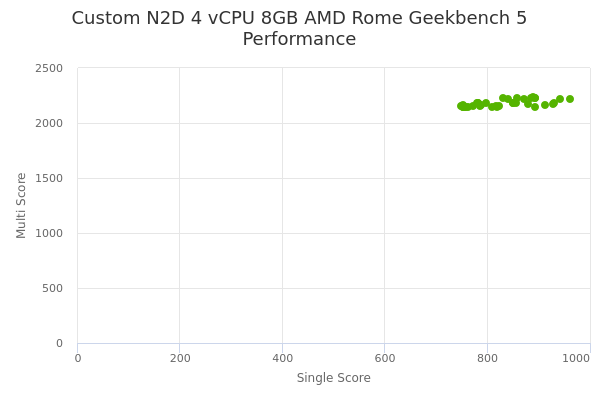
| Single | Multi | |
|---|---|---|
| Max | 1126 | 2759 |
| Average | 864 | 2251 |
| Deviation | 114.05 | 193.76 |
| Min | 750 | 2142 |
Sign up as Freemium to get more insight.
- In same series
- Custom N2D 2 vCPU 3GB AMD Rome
- Custom N2D 2 vCPU 4GB AMD Rome
- Custom N2D 2 vCPU 6GB AMD Rome
- Custom N2D 2 vCPU 8GB AMD Rome
- Custom N2D 2 vCPU 12GB AMD Rome
- Custom N2D 2 vCPU 16GB AMD Rome
- Custom N2D 4 vCPU 4GB AMD Rome
- Custom N2D 4 vCPU 6GB AMD Rome
- Custom N2D 4 vCPU 8GB AMD Rome
- Custom N2D 4 vCPU 12GB AMD Rome
- Custom N2D 4 vCPU 16GB AMD Rome
- Custom N2D 4 vCPU 24GB AMD Rome
- Custom N2D 4 vCPU 32GB AMD Rome
- Custom N2D 8 vCPU 8GB AMD Rome
- Custom N2D 8 vCPU 12GB AMD Rome
- Custom N2D 8 vCPU 16GB AMD Rome
- Custom N2D 8 vCPU 24GB AMD Rome
- Custom N2D 8 vCPU 32GB AMD Rome
- Custom N2D 8 vCPU 48GB AMD Rome
- Custom N2D 8 vCPU 64GB AMD Rome
- Custom N2D 16 vCPU 16GB AMD Rome
- Custom N2D 16 vCPU 24GB AMD Rome
- Custom N2D 16 vCPU 32GB AMD Rome
- Custom N2D 16 vCPU 48GB AMD Rome
- Custom N2D 16 vCPU 64GB AMD Rome
- Custom N2D 16 vCPU 96GB AMD Rome
- Custom N2D 16 vCPU 128GB AMD Rome
- Custom N2D 32 vCPU 32GB AMD Rome
- Custom N2D 32 vCPU 48GB AMD Rome
- Custom N2D 32 vCPU 64GB AMD Rome
- Custom N2D 32 vCPU 96GB AMD Rome
- Custom N2D 32 vCPU 128GB AMD Rome
- Custom N2D 32 vCPU 160GB AMD Rome
- Custom N2D 32 vCPU 192GB AMD Rome
- Custom N2D 32 vCPU 224GB AMD Rome
- Custom N2D 32 vCPU 256GB AMD Rome
- Custom N2D 48 vCPU 48GB AMD Rome
- Custom N2D 48 vCPU 64GB AMD Rome
- Custom N2D 48 vCPU 96GB AMD Rome
- Custom N2D 48 vCPU 128GB AMD Rome
- Custom N2D 48 vCPU 160GB AMD Rome
- Custom N2D 48 vCPU 192GB AMD Rome
- Custom N2D 48 vCPU 224GB AMD Rome
- Custom N2D 48 vCPU 256GB AMD Rome
- Custom N2D 48 vCPU 320GB AMD Rome
- Custom N2D 48 vCPU 384GB AMD Rome
- Custom N2D 64 vCPU 64GB AMD Rome
- Custom N2D 64 vCPU 96GB AMD Rome
- Custom N2D 64 vCPU 128GB AMD Rome
- Custom N2D 64 vCPU 160GB AMD Rome
- Custom N2D 64 vCPU 192GB AMD Rome
- Custom N2D 64 vCPU 224GB AMD Rome
- Custom N2D 64 vCPU 256GB AMD Rome
- Custom N2D 64 vCPU 320GB AMD Rome
- Custom N2D 64 vCPU 384GB AMD Rome
- Custom N2D 64 vCPU 416GB AMD Rome
- Custom N2D 64 vCPU 455GB AMD Rome
- Custom N2D 64 vCPU 512GB AMD Rome
- Custom N2D 80 vCPU 96GB AMD Rome
- Custom N2D 80 vCPU 128GB AMD Rome
- Custom N2D 80 vCPU 160GB AMD Rome
- Custom N2D 80 vCPU 192GB AMD Rome
- Custom N2D 80 vCPU 224GB AMD Rome
- Custom N2D 80 vCPU 256GB AMD Rome
- Custom N2D 80 vCPU 320GB AMD Rome
- Custom N2D 80 vCPU 384GB AMD Rome
- Custom N2D 80 vCPU 416GB AMD Rome
- Custom N2D 80 vCPU 455GB AMD Rome
- Custom N2D 80 vCPU 512GB AMD Rome
- Custom N2D 80 vCPU 624GB AMD Rome
- Custom N2D 96 vCPU 96GB AMD Rome
- Custom N2D 96 vCPU 128GB AMD Rome
- Custom N2D 96 vCPU 160GB AMD Rome
- Custom N2D 96 vCPU 192GB AMD Rome
- Custom N2D 96 vCPU 224GB AMD Rome
- Custom N2D 96 vCPU 256GB AMD Rome
- Custom N2D 96 vCPU 320GB AMD Rome
- Custom N2D 96 vCPU 384GB AMD Rome
- Custom N2D 96 vCPU 416GB AMD Rome
- Custom N2D 96 vCPU 455GB AMD Rome
- Custom N2D 96 vCPU 512GB AMD Rome
- Custom N2D 96 vCPU 624GB AMD Rome
- Custom N2D 96 vCPU 768GB AMD Rome