n2-standard-8 Intel Cascade Lake NVME SSD by Google Cloud
Geekbench is a cross-platform processor benchmark with a scoring system that determines single-core and multi-core performance using loads simulating real-world scenarios. Geekbench 5 score is calculated with a reference score of 2500 representing the performance of the Intel Core i5-2520M @ 2.50 GHz. The software benchmark is available for Mac OS, Windows, Linux, Android and iOS platforms.
Specifications:
CPU
8
RAM
32.0 GB
Extra
4x
375 GB
SSD
{
"configuration": {
"chart": {
"type": "scatter",
"polar": false,
"zoomType": "",
"options3d": {},
"height": null,
"width": null,
"margin": null,
"inverted": false,
"zooming": {}
},
"credits": {
"enabled": false
},
"title": {
"text": ""
},
"colorAxis": null,
"subtitle": {
"text": ""
},
"xAxis": {
"title": {
"text": [
"Single Score"
],
"useHTML": false,
"style": {
"color": "#666666"
}
},
"categories": null,
"lineWidth": 1,
"tickInterval": null,
"tickWidth": 1,
"tickLength": 10,
"tickPixelInterval": 100,
"plotLines": null,
"labels": {
"enabled": true,
"format": null,
"formatter": "",
"style": {
"color": "#666666",
"cursor": "default",
"fontSize": "11px"
},
"useHTML": false,
"step": 0
},
"plotBands": null,
"visible": true,
"floor": null,
"ceiling": null,
"type": "linear",
"min": 0,
"gridLineWidth": 1,
"gridLineColor": "#e6e6e6",
"minorTickInterval": null,
"minorTickWidth": 0,
"minTickInterval": null,
"startOnTick": true,
"endOnTick": true,
"tickmarkPlacement": 100,
"units": 100,
"minRange": 100
},
"yAxis": {
"title": {
"text": [
"Multi Score"
],
"useHTML": false,
"style": {
"color": "#666666"
}
},
"categories": null,
"plotLines": null,
"plotBands": null,
"lineWidth": null,
"tickInterval": null,
"tickLength": 10,
"floor": null,
"ceiling": null,
"gridLineInterpolation": null,
"gridLineWidth": 1,
"gridLineColor": "#e6e6e6",
"min": 0,
"max": null,
"minorTickInterval": null,
"minorTickWidth": 0,
"minTickInterval": null,
"startOnTick": true,
"endOnTick": true,
"minRange": null,
"type": "linear",
"tickmarkPlacement": null,
"labels": {
"enabled": true,
"formatter": null,
"style": {
"color": "#666666",
"cursor": "default",
"fontSize": "11px"
},
"useHTML": false
}
},
"zAxis": {
"title": {
"text": "Multi Score"
}
},
"plotOptions": {
"series": {
"dataLabels": {
"enabled": false,
"format": null,
"distance": 30,
"align": "center",
"inside": null,
"allowOverlap": false,
"style": {
"fontSize": "11px"
}
},
"showInLegend": null,
"turboThreshold": 0,
"stacking": "",
"groupPadding": 0.2,
"centerInCategory": false,
"findNearestPointBy": "x"
}
},
"navigator": {
"enabled": false
},
"scrollbar": {
"enabled": false
},
"rangeSelector": {
"enabled": false,
"inputEnabled": false
},
"legend": {
"enabled": null,
"maxHeight": null,
"align": "center",
"verticalAlign": "bottom",
"layout": "horizontal",
"width": null,
"margin": 12,
"reversed": false
},
"series": [
{
"name": "n2-standard-8 Intel Cascade Lake NVME SSD by Google Cloud",
"color": "#55b400",
"data": [
{
"x": 955.0826478409676,
"y": 4371.614479750307
},
{
"x": 943.729207835087,
"y": 4343.521877789215
},
{
"x": 954.0289843850517,
"y": 4382.7075535149925
},
{
"x": 946.8686665753612,
"y": 4351.680219935179
},
{
"x": 958.5296960721728,
"y": 4378.993455018201
},
{
"x": 953.8381690623529,
"y": 4357.2863853283625
},
{
"x": 954.8739221522399,
"y": 4358.124161603836
},
{
"x": 956.7060371234629,
"y": 4375.165314327834
},
{
"x": 957.4968953170816,
"y": 4373.9715829925735
},
{
"x": 956.0470178150404,
"y": 4354.952395313171
},
{
"x": 959.4650780254124,
"y": 4369.722601491236
},
{
"x": 954.7013367224206,
"y": 4334.006632411922
},
{
"x": 958.8711849999254,
"y": 4372.8459006464145
},
{
"x": 934.4160658364654,
"y": 4358.7396289676935
},
{
"x": 959.839990031867,
"y": 4373.338738878792
},
{
"x": 951.7113931678268,
"y": 4345.623864337873
},
{
"x": 956.3173503615021,
"y": 4364.747818786094
},
{
"x": 951.1005515227254,
"y": 4336.604634711404
},
{
"x": 958.2411537880504,
"y": 4374.879102196382
},
{
"x": 944.3692401837886,
"y": 4336.956305645312
}
]
}
],
"drilldown": {},
"tooltip": {
"enabled": true,
"useHTML": false,
"headerFormat": "",
"pointFormat": "<span style=\"color:{series.color}\">Single</span>: <b>{point.x:.0f}</b><br><span style=\"color:{series.color}\">Multi</span>: <b>{point.y:.0f}</b>",
"footerFormat": "",
"shared": false,
"outside": false,
"valueDecimals": null,
"split": false
},
"annotations": null
},
"hc_type": "chart",
"id": "320963334940420516364284219267985101575"
}
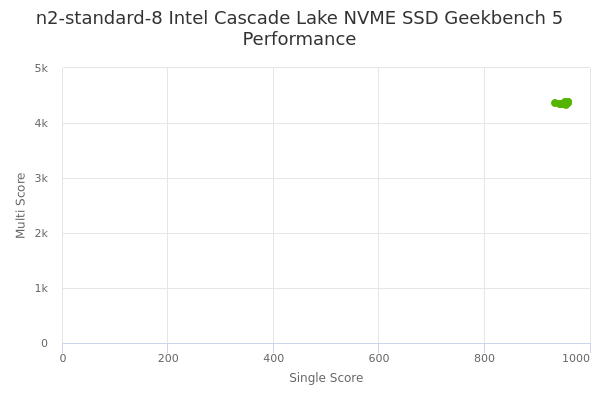
| Single | Multi | |
|---|---|---|
| Max | 960 | 4383 |
| Average | 953 | 4361 |
| Deviation | 6.30 | 14.91 |
| Min | 934 | 4334 |
Sign up as Freemium to get more insight.
- In same series
- n2-standard-2 Intel Cascade Lake NVME SSD
- n2-standard-4 Intel Cascade Lake NVME SSD
- n2-standard-8 Intel Cascade Lake NVME SSD
- n2-standard-16 Intel Cascade Lake NVME SSD
- n2-standard-32 Intel Cascade Lake NVME SSD
- n2-standard-48 Intel Cascade Lake NVME SSD
- n2-standard-64 Intel Cascade Lake NVME SSD