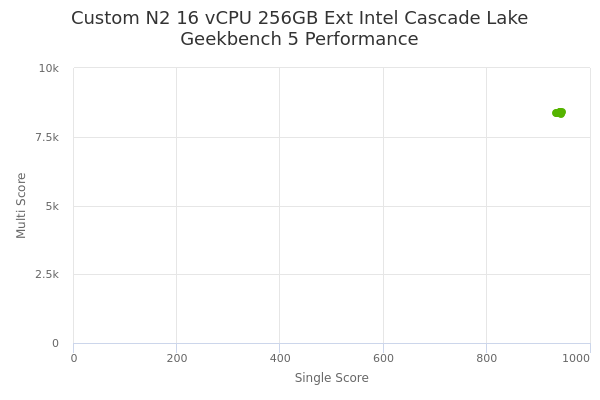
Custom N2 16 vCPU 256GB Ext Intel Cascade Lake by Google Cloud
Geekbench is a cross-platform processor benchmark with a scoring system that determines single-core and multi-core performance using loads simulating real-world scenarios. Geekbench 5 score is calculated with a reference score of 2500 representing the performance of the Intel Core i5-2520M @ 2.50 GHz. The software benchmark is available for Mac OS, Windows, Linux, Android and iOS platforms.
Specifications:
CPU
16
RAM
256.0 GB
{
"configuration": {
"chart": {
"type": "scatter",
"polar": false,
"zoomType": "",
"options3d": {},
"height": null,
"width": null,
"margin": null,
"inverted": false,
"zooming": {}
},
"credits": {
"enabled": false
},
"title": {
"text": ""
},
"colorAxis": null,
"subtitle": {
"text": ""
},
"xAxis": {
"title": {
"text": [
"Single Score"
],
"useHTML": false,
"style": {
"color": "#666666"
}
},
"categories": null,
"lineWidth": 1,
"tickInterval": null,
"tickWidth": 1,
"tickLength": 10,
"tickPixelInterval": 100,
"plotLines": null,
"labels": {
"enabled": true,
"format": null,
"formatter": "",
"style": {
"color": "#666666",
"cursor": "default",
"fontSize": "11px"
},
"useHTML": false,
"step": 0
},
"plotBands": null,
"visible": true,
"floor": null,
"ceiling": null,
"type": "linear",
"min": 0,
"gridLineWidth": 1,
"gridLineColor": "#e6e6e6",
"minorTickInterval": null,
"minorTickWidth": 0,
"minTickInterval": null,
"startOnTick": true,
"endOnTick": true,
"tickmarkPlacement": 100,
"units": 100,
"minRange": 100
},
"yAxis": {
"title": {
"text": [
"Multi Score"
],
"useHTML": false,
"style": {
"color": "#666666"
}
},
"categories": null,
"plotLines": null,
"plotBands": null,
"lineWidth": null,
"tickInterval": null,
"tickLength": 10,
"floor": null,
"ceiling": null,
"gridLineInterpolation": null,
"gridLineWidth": 1,
"gridLineColor": "#e6e6e6",
"min": 0,
"max": null,
"minorTickInterval": null,
"minorTickWidth": 0,
"minTickInterval": null,
"startOnTick": true,
"endOnTick": true,
"minRange": null,
"type": "linear",
"tickmarkPlacement": null,
"labels": {
"enabled": true,
"formatter": null,
"style": {
"color": "#666666",
"cursor": "default",
"fontSize": "11px"
},
"useHTML": false
}
},
"zAxis": {
"title": {
"text": "Multi Score"
}
},
"plotOptions": {
"series": {
"dataLabels": {
"enabled": false,
"format": null,
"distance": 30,
"align": "center",
"inside": null,
"allowOverlap": false,
"style": {
"fontSize": "11px"
}
},
"showInLegend": null,
"turboThreshold": 0,
"stacking": "",
"groupPadding": 0.2,
"centerInCategory": false,
"findNearestPointBy": "x"
}
},
"navigator": {
"enabled": false
},
"scrollbar": {
"enabled": false
},
"rangeSelector": {
"enabled": false,
"inputEnabled": false
},
"legend": {
"enabled": null,
"maxHeight": null,
"align": "center",
"verticalAlign": "bottom",
"layout": "horizontal",
"width": null,
"margin": 12,
"reversed": false
},
"series": [
{
"name": "Custom N2 16 vCPU 256GB Ext Intel Cascade Lake by Google Cloud",
"color": "#55b400",
"data": [
{
"x": 943.9301483252113,
"y": 8377.900590946376
},
{
"x": 936.4583111406055,
"y": 8356.135585020385
},
{
"x": 943.1076951743034,
"y": 8377.330184652314
},
{
"x": 946.3496227321996,
"y": 8385.90294353766
},
{
"x": 943.1978426483855,
"y": 8354.631267334998
},
{
"x": 935.9289554781997,
"y": 8375.661741849737
},
{
"x": 943.9746263311113,
"y": 8327.930109078537
},
{
"x": 942.4266036380968,
"y": 8390.863680354652
},
{
"x": 939.6344168882254,
"y": 8373.133083779327
},
{
"x": 943.2980911202112,
"y": 8385.457850899633
},
{
"x": 939.5447881399871,
"y": 8381.330774747137
},
{
"x": 942.1451552365143,
"y": 8372.03427725358
},
{
"x": 943.5949951148955,
"y": 8367.168425793543
},
{
"x": 939.2113140888287,
"y": 8380.20378748155
},
{
"x": 942.4866551896234,
"y": 8369.293390279392
},
{
"x": 938.3720474802313,
"y": 8368.941883876956
},
{
"x": 944.1790016685277,
"y": 8373.317527920015
},
{
"x": 942.353824595152,
"y": 8352.761991496473
},
{
"x": 943.1082785802353,
"y": 8393.73264153187
},
{
"x": 937.449951234539,
"y": 8371.68754788438
}
]
}
],
"drilldown": {},
"tooltip": {
"enabled": true,
"useHTML": false,
"format": null,
"headerFormat": "",
"pointFormat": "<span style=\"color:{series.color}\">Single</span>: <b>{point.x:.0f}</b><br><span style=\"color:{series.color}\">Multi</span>: <b>{point.y:.0f}</b>",
"footerFormat": "",
"shared": false,
"outside": false,
"valueDecimals": null,
"split": false
},
"annotations": null
},
"hc_type": "chart",
"id": "149821177156929746106858089732050837117"
}
| Single | Multi | |
|---|---|---|
| Max | 946 | 8394 |
| Average | 942 | 8372 |
| Deviation | 2.80 | 14.73 |
| Min | 936 | 8328 |
Sign up as Freemium to get more insight.
- In same series
- Custom N2 2 vCPU 24GB Ext Intel Cascade Lake
- Custom N2 2 vCPU 32GB Ext Intel Cascade Lake
- Custom N2 2 vCPU 48GB Ext Intel Cascade Lake
- Custom N2 2 vCPU 64GB Ext Intel Cascade Lake
- Custom N2 2 vCPU 96GB Ext Intel Cascade Lake
- Custom N2 2 vCPU 128GB Ext Intel Cascade Lake
- Custom N2 2 vCPU 160GB Ext Intel Cascade Lake
- Custom N2 2 vCPU 192GB Ext Intel Cascade Lake
- Custom N2 2 vCPU 224GB Ext Intel Cascade Lake
- Custom N2 2 vCPU 256GB Ext Intel Cascade Lake
- Custom N2 2 vCPU 320GB Ext Intel Cascade Lake
- Custom N2 2 vCPU 384GB Ext Intel Cascade Lake
- Custom N2 2 vCPU 416GB Ext Intel Cascade Lake
- Custom N2 2 vCPU 455GB Ext Intel Cascade Lake
- Custom N2 2 vCPU 512GB Ext Intel Cascade Lake
- Custom N2 2 vCPU 624GB Ext Intel Cascade Lake
- Custom N2 4 vCPU 48GB Ext Intel Cascade Lake
- Custom N2 4 vCPU 64GB Ext Intel Cascade Lake
- Custom N2 4 vCPU 96GB Ext Intel Cascade Lake
- Custom N2 4 vCPU 128GB Ext Intel Cascade Lake
- Custom N2 4 vCPU 160GB Ext Intel Cascade Lake
- Custom N2 4 vCPU 192GB Ext Intel Cascade Lake
- Custom N2 4 vCPU 224GB Ext Intel Cascade Lake
- Custom N2 4 vCPU 256GB Ext Intel Cascade Lake
- Custom N2 4 vCPU 320GB Ext Intel Cascade Lake
- Custom N2 4 vCPU 384GB Ext Intel Cascade Lake
- Custom N2 4 vCPU 416GB Ext Intel Cascade Lake
- Custom N2 4 vCPU 455GB Ext Intel Cascade Lake
- Custom N2 4 vCPU 512GB Ext Intel Cascade Lake
- Custom N2 4 vCPU 624GB Ext Intel Cascade Lake
- Custom N2 6 vCPU 64GB Ext Intel Cascade Lake
- Custom N2 6 vCPU 128GB Ext Intel Cascade Lake
- Custom N2 6 vCPU 192GB Ext Intel Cascade Lake
- Custom N2 6 vCPU 256GB Ext Intel Cascade Lake
- Custom N2 6 vCPU 384GB Ext Intel Cascade Lake
- Custom N2 6 vCPU 512GB Ext Intel Cascade Lake
- Custom N2 8 vCPU 96GB Ext Intel Cascade Lake
- Custom N2 8 vCPU 128GB Ext Intel Cascade Lake
- Custom N2 8 vCPU 160GB Ext Intel Cascade Lake
- Custom N2 8 vCPU 192GB Ext Intel Cascade Lake
- Custom N2 8 vCPU 224GB Ext Intel Cascade Lake
- Custom N2 8 vCPU 256GB Ext Intel Cascade Lake
- Custom N2 8 vCPU 320GB Ext Intel Cascade Lake
- Custom N2 8 vCPU 384GB Ext Intel Cascade Lake
- Custom N2 8 vCPU 416GB Ext Intel Cascade Lake
- Custom N2 8 vCPU 455GB Ext Intel Cascade Lake
- Custom N2 8 vCPU 512GB Ext Intel Cascade Lake
- Custom N2 8 vCPU 624GB Ext Intel Cascade Lake
- Custom N2 10 vCPU 96GB Ext Intel Cascade Lake
- Custom N2 10 vCPU 128GB Ext Intel Cascade Lake
- Custom N2 10 vCPU 160GB Ext Intel Cascade Lake
- Custom N2 10 vCPU 192GB Ext Intel Cascade Lake
- Custom N2 10 vCPU 224GB Ext Intel Cascade Lake
- Custom N2 10 vCPU 256GB Ext Intel Cascade Lake
- Custom N2 10 vCPU 320GB Ext Intel Cascade Lake
- Custom N2 10 vCPU 384GB Ext Intel Cascade Lake
- Custom N2 10 vCPU 416GB Ext Intel Cascade Lake
- Custom N2 10 vCPU 455GB Ext Intel Cascade Lake
- Custom N2 10 vCPU 512GB Ext Intel Cascade Lake
- Custom N2 10 vCPU 624GB Ext Intel Cascade Lake
- Custom N2 12 vCPU 128GB Ext Intel Cascade Lake
- Custom N2 12 vCPU 160GB Ext Intel Cascade Lake
- Custom N2 12 vCPU 192GB Ext Intel Cascade Lake
- Custom N2 12 vCPU 224GB Ext Intel Cascade Lake
- Custom N2 12 vCPU 256GB Ext Intel Cascade Lake
- Custom N2 12 vCPU 320GB Ext Intel Cascade Lake
- Custom N2 12 vCPU 384GB Ext Intel Cascade Lake
- Custom N2 12 vCPU 416GB Ext Intel Cascade Lake
- Custom N2 12 vCPU 455GB Ext Intel Cascade Lake
- Custom N2 12 vCPU 512GB Ext Intel Cascade Lake
- Custom N2 12 vCPU 624GB Ext Intel Cascade Lake
- Custom N2 16 vCPU 160GB Ext Intel Cascade Lake
- Custom N2 16 vCPU 192GB Ext Intel Cascade Lake
- Custom N2 16 vCPU 224GB Ext Intel Cascade Lake
- Custom N2 16 vCPU 256GB Ext Intel Cascade Lake
- Custom N2 16 vCPU 320GB Ext Intel Cascade Lake
- Custom N2 16 vCPU 384GB Ext Intel Cascade Lake
- Custom N2 16 vCPU 416GB Ext Intel Cascade Lake
- Custom N2 16 vCPU 455GB Ext Intel Cascade Lake
- Custom N2 16 vCPU 512GB Ext Intel Cascade Lake
- Custom N2 16 vCPU 624GB Ext Intel Cascade Lake
- Custom N2 20 vCPU 192GB Ext Intel Cascade Lake
- Custom N2 20 vCPU 224GB Ext Intel Cascade Lake
- Custom N2 20 vCPU 256GB Ext Intel Cascade Lake
- Custom N2 20 vCPU 320GB Ext Intel Cascade Lake
- Custom N2 20 vCPU 384GB Ext Intel Cascade Lake
- Custom N2 20 vCPU 416GB Ext Intel Cascade Lake
- Custom N2 20 vCPU 455GB Ext Intel Cascade Lake
- Custom N2 20 vCPU 512GB Ext Intel Cascade Lake
- Custom N2 20 vCPU 624GB Ext Intel Cascade Lake
- Custom N2 24 vCPU 224GB Ext Intel Cascade Lake
- Custom N2 24 vCPU 256GB Ext Intel Cascade Lake
- Custom N2 24 vCPU 320GB Ext Intel Cascade Lake
- Custom N2 24 vCPU 384GB Ext Intel Cascade Lake
- Custom N2 24 vCPU 416GB Ext Intel Cascade Lake
- Custom N2 24 vCPU 455GB Ext Intel Cascade Lake
- Custom N2 24 vCPU 512GB Ext Intel Cascade Lake
- Custom N2 24 vCPU 624GB Ext Intel Cascade Lake
- Custom N2 28 vCPU 256GB Ext Intel Cascade Lake
- Custom N2 28 vCPU 320GB Ext Intel Cascade Lake
- Custom N2 28 vCPU 384GB Ext Intel Cascade Lake
- Custom N2 28 vCPU 416GB Ext Intel Cascade Lake
- Custom N2 28 vCPU 455GB Ext Intel Cascade Lake
- Custom N2 28 vCPU 512GB Ext Intel Cascade Lake
- Custom N2 28 vCPU 624GB Ext Intel Cascade Lake
- Custom N2 32 vCPU 320GB Ext Intel Cascade Lake
- Custom N2 32 vCPU 384GB Ext Intel Cascade Lake
- Custom N2 32 vCPU 416GB Ext Intel Cascade Lake
- Custom N2 32 vCPU 455GB Ext Intel Cascade Lake
- Custom N2 32 vCPU 512GB Ext Intel Cascade Lake
- Custom N2 32 vCPU 624GB Ext Intel Cascade Lake
- Custom N2 48 vCPU 416GB Ext Intel Cascade Lake
- Custom N2 48 vCPU 455GB Ext Intel Cascade Lake
- Custom N2 48 vCPU 512GB Ext Intel Cascade Lake
- Custom N2 48 vCPU 624GB Ext Intel Cascade Lake
- Custom N2 56 vCPU 455GB Ext Intel Cascade Lake
- Custom N2 56 vCPU 512GB Ext Intel Cascade Lake
- Custom N2 56 vCPU 624GB Ext Intel Cascade Lake
- Custom N2 64 vCPU 624GB Ext Intel Cascade Lake