n1-standard-4 Intel Skylake NVME SSD by Google Cloud
Geekbench is a cross-platform processor benchmark with a scoring system that determines single-core and multi-core performance using loads simulating real-world scenarios. Geekbench 5 score is calculated with a reference score of 2500 representing the performance of the Intel Core i5-2520M @ 2.50 GHz. The software benchmark is available for Mac OS, Windows, Linux, Android and iOS platforms.
Specifications:
CPU
4
RAM
15.0 GB
Extra
2x
375 GB
SSD
{
"configuration": {
"chart": {
"type": "scatter",
"polar": false,
"zoomType": "",
"options3d": {},
"height": null,
"width": null,
"margin": null,
"inverted": false,
"zooming": {}
},
"credits": {
"enabled": false
},
"title": {
"text": ""
},
"colorAxis": null,
"subtitle": {
"text": ""
},
"xAxis": {
"title": {
"text": [
"Single Score"
],
"useHTML": false,
"style": {
"color": "#666666"
}
},
"categories": null,
"lineWidth": 1,
"tickInterval": null,
"tickWidth": 1,
"tickLength": 10,
"tickPixelInterval": 100,
"plotLines": null,
"labels": {
"enabled": true,
"format": null,
"formatter": "",
"style": {
"color": "#666666",
"cursor": "default",
"fontSize": "11px"
},
"useHTML": false,
"step": 0
},
"plotBands": null,
"visible": true,
"floor": null,
"ceiling": null,
"type": "linear",
"min": 0,
"gridLineWidth": 1,
"gridLineColor": "#e6e6e6",
"minorTickInterval": null,
"minorTickWidth": 0,
"minTickInterval": null,
"startOnTick": true,
"endOnTick": true,
"tickmarkPlacement": 100,
"units": 100,
"minRange": 100
},
"yAxis": {
"title": {
"text": [
"Multi Score"
],
"useHTML": false,
"style": {
"color": "#666666"
}
},
"categories": null,
"plotLines": null,
"plotBands": null,
"lineWidth": null,
"tickInterval": null,
"tickLength": 10,
"floor": null,
"ceiling": null,
"gridLineInterpolation": null,
"gridLineWidth": 1,
"gridLineColor": "#e6e6e6",
"min": 0,
"max": null,
"minorTickInterval": null,
"minorTickWidth": 0,
"minTickInterval": null,
"startOnTick": true,
"endOnTick": true,
"minRange": null,
"type": "linear",
"tickmarkPlacement": null,
"labels": {
"enabled": true,
"formatter": null,
"style": {
"color": "#666666",
"cursor": "default",
"fontSize": "11px"
},
"useHTML": false
}
},
"zAxis": {
"title": {
"text": "Multi Score"
}
},
"plotOptions": {
"series": {
"dataLabels": {
"enabled": false,
"format": null,
"distance": 30,
"align": "center",
"inside": null,
"allowOverlap": false,
"style": {
"fontSize": "11px"
}
},
"showInLegend": null,
"turboThreshold": 0,
"stacking": "",
"groupPadding": 0.2,
"centerInCategory": false,
"findNearestPointBy": "x"
}
},
"navigator": {
"enabled": false
},
"scrollbar": {
"enabled": false
},
"rangeSelector": {
"enabled": false,
"inputEnabled": false
},
"legend": {
"enabled": null,
"maxHeight": null,
"align": "center",
"verticalAlign": "bottom",
"layout": "horizontal",
"width": null,
"margin": 12,
"reversed": false
},
"series": [
{
"name": "n1-standard-4 Intel Skylake NVME SSD by Google Cloud",
"color": "#55b400",
"data": [
{
"x": 775.2087909110576,
"y": 1797.7529900605286
},
{
"x": 765.4427360953514,
"y": 1771.4452146660856
},
{
"x": 769.2901424840804,
"y": 1781.5333774953237
},
{
"x": 747.7053150975689,
"y": 1778.1168360797087
},
{
"x": 762.5519170215201,
"y": 1797.172651329653
},
{
"x": 752.0284408122791,
"y": 1756.2915586508886
},
{
"x": 763.5162767446349,
"y": 1785.443965638121
},
{
"x": 752.5384622878967,
"y": 1779.3832013981898
},
{
"x": 771.1446149845235,
"y": 1801.18623807096
},
{
"x": 751.6422683037625,
"y": 1761.3062216556675
}
]
}
],
"drilldown": {},
"tooltip": {
"enabled": true,
"useHTML": false,
"headerFormat": "",
"pointFormat": "<span style=\"color:{series.color}\">Single</span>: <b>{point.x:.0f}</b><br><span style=\"color:{series.color}\">Multi</span>: <b>{point.y:.0f}</b>",
"footerFormat": "",
"shared": false,
"outside": false,
"valueDecimals": null,
"split": false
},
"annotations": null
},
"hc_type": "chart",
"id": "22519933315730200278849727983521751404"
}
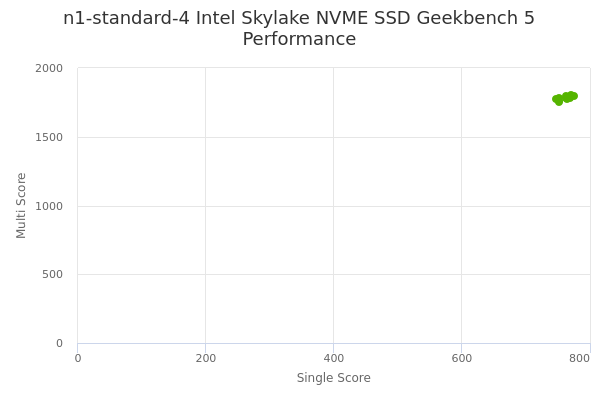
| Single | Multi | |
|---|---|---|
| Max | 775 | 1801 |
| Average | 761 | 1781 |
| Deviation | 9.05 | 14.39 |
| Min | 748 | 1756 |
Sign up as Freemium to get more insight.
- In same series
- n1-standard-1 Intel Skylake NVME SSD
- n1-standard-2 Intel Skylake NVME SSD
- n1-standard-4 Intel Skylake NVME SSD
- n1-standard-8 Intel Skylake NVME SSD
- n1-standard-16 Intel Skylake NVME SSD
- n1-standard-32 Intel Skylake NVME SSD
- n1-standard-64 Intel Skylake NVME SSD
- n1-standard-96 Intel Skylake NVME SSD