n1-standard-4 Intel Skylake Tesla V100 by Google Cloud
Geekbench is a cross-platform processor benchmark with a scoring system that determines single-core and multi-core performance using loads simulating real-world scenarios. Geekbench 5 score is calculated with a reference score of 2500 representing the performance of the Intel Core i5-2520M @ 2.50 GHz. The software benchmark is available for Mac OS, Windows, Linux, Android and iOS platforms.
Specifications:
CPU
4
RAM
15.0 GB
GPU
1
Tesla V100
{
"configuration": {
"chart": {
"type": "scatter",
"polar": false,
"zoomType": "",
"options3d": {},
"height": null,
"width": null,
"margin": null,
"inverted": false,
"zooming": {}
},
"credits": {
"enabled": false
},
"title": {
"text": ""
},
"colorAxis": null,
"subtitle": {
"text": ""
},
"xAxis": {
"title": {
"text": [
"Single Score"
],
"useHTML": false,
"style": {
"color": "#666666"
}
},
"categories": null,
"lineWidth": 1,
"tickInterval": null,
"tickWidth": 1,
"tickLength": 10,
"tickPixelInterval": 100,
"plotLines": null,
"labels": {
"enabled": true,
"format": null,
"formatter": "",
"style": {
"color": "#666666",
"cursor": "default",
"fontSize": "11px"
},
"useHTML": false,
"step": 0
},
"plotBands": null,
"visible": true,
"floor": null,
"ceiling": null,
"type": "linear",
"min": 0,
"gridLineWidth": 1,
"gridLineColor": "#e6e6e6",
"minorTickInterval": null,
"minorTickWidth": 0,
"minTickInterval": null,
"startOnTick": true,
"endOnTick": true,
"tickmarkPlacement": 100,
"units": 100,
"minRange": 100
},
"yAxis": {
"title": {
"text": [
"Multi Score"
],
"useHTML": false,
"style": {
"color": "#666666"
}
},
"categories": null,
"plotLines": null,
"plotBands": null,
"lineWidth": null,
"tickInterval": null,
"tickLength": 10,
"floor": null,
"ceiling": null,
"gridLineInterpolation": null,
"gridLineWidth": 1,
"gridLineColor": "#e6e6e6",
"min": 0,
"max": null,
"minorTickInterval": null,
"minorTickWidth": 0,
"minTickInterval": null,
"startOnTick": true,
"endOnTick": true,
"minRange": null,
"type": "linear",
"tickmarkPlacement": null,
"labels": {
"enabled": true,
"formatter": null,
"style": {
"color": "#666666",
"cursor": "default",
"fontSize": "11px"
},
"useHTML": false
}
},
"zAxis": {
"title": {
"text": "Multi Score"
}
},
"plotOptions": {
"series": {
"dataLabels": {
"enabled": false,
"format": null,
"distance": 30,
"align": "center",
"inside": null,
"allowOverlap": false,
"style": {
"fontSize": "11px"
}
},
"showInLegend": null,
"turboThreshold": 0,
"stacking": "",
"groupPadding": 0.2,
"centerInCategory": false,
"findNearestPointBy": "x"
}
},
"navigator": {
"enabled": false
},
"scrollbar": {
"enabled": false
},
"rangeSelector": {
"enabled": false,
"inputEnabled": false
},
"legend": {
"enabled": null,
"maxHeight": null,
"align": "center",
"verticalAlign": "bottom",
"layout": "horizontal",
"width": null,
"margin": 12,
"reversed": false
},
"series": [
{
"name": "n1-standard-4 Intel Skylake Tesla V100 by Google Cloud",
"color": "#55b400",
"data": [
{
"x": 851.8153844383623,
"y": 2009.008887240862
},
{
"x": 804.8319836249075,
"y": 1883.5048163261176
},
{
"x": 862.7731984353084,
"y": 2048.1678249024085
},
{
"x": 800.4229989918714,
"y": 1873.1435413827746
},
{
"x": 858.9293317446584,
"y": 2029.2387153429936
},
{
"x": 796.3134038368121,
"y": 1871.682326976823
},
{
"x": 862.0343367465009,
"y": 2089.2912833946225
},
{
"x": 799.5409020596646,
"y": 1869.324517111896
},
{
"x": 878.7007981253348,
"y": 2076.952722727773
},
{
"x": 792.9230009709202,
"y": 1864.3279773257022
},
{
"x": 876.440516119458,
"y": 2081.316859541116
},
{
"x": 790.4310772664375,
"y": 1877.9837791246432
},
{
"x": 876.7360236845193,
"y": 2076.7766683745012
},
{
"x": 798.3816280923005,
"y": 1863.5946089006104
},
{
"x": 875.4677792685573,
"y": 2088.11206920819
},
{
"x": 788.1177559780172,
"y": 1870.187362797787
},
{
"x": 878.8723905787908,
"y": 2082.1259053893777
},
{
"x": 805.8191656660565,
"y": 1901.056489494563
},
{
"x": 866.8714680479543,
"y": 2091.9809388890503
},
{
"x": 809.1444400348961,
"y": 1888.964839816866
}
]
}
],
"drilldown": {},
"tooltip": {
"enabled": true,
"useHTML": false,
"format": null,
"headerFormat": "",
"pointFormat": "<span style=\"color:{series.color}\">Single</span>: <b>{point.x:.0f}</b><br><span style=\"color:{series.color}\">Multi</span>: <b>{point.y:.0f}</b>",
"footerFormat": "",
"shared": false,
"outside": false,
"valueDecimals": null,
"split": false
},
"annotations": null
},
"hc_type": "chart",
"id": "88335999936739377642745080778076835560"
}
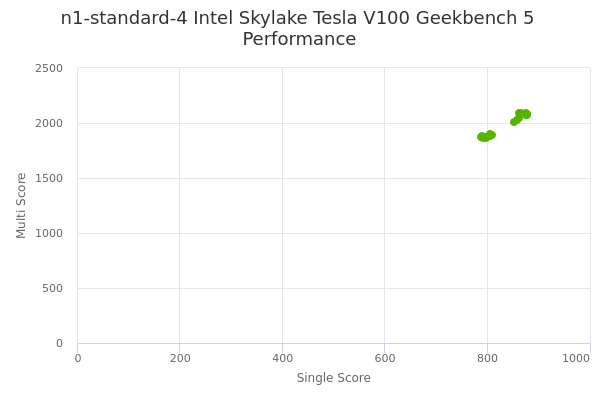
| Single | Multi | |
|---|---|---|
| Max | 879 | 2092 |
| Average | 834 | 1972 |
| Deviation | 36.02 | 97.68 |
| Min | 788 | 1864 |
Sign up as Freemium to get more insight.
- In same series
- n1-standard-1 Intel Skylake 2x Tesla V100
- n1-standard-1 Intel Skylake 4x Tesla V100
- n1-standard-1 Intel Skylake 8x Tesla V100
- n1-standard-1 Intel Skylake Tesla V100
- n1-standard-4 Intel Skylake 2x Tesla V100
- n1-standard-4 Intel Skylake 4x Tesla V100
- n1-standard-4 Intel Skylake 8x Tesla V100
- n1-standard-4 Intel Skylake Tesla V100
- n1-standard-8 Intel Skylake 2x Tesla V100
- n1-standard-8 Intel Skylake 4x Tesla V100
- n1-standard-8 Intel Skylake 8x Tesla V100
- n1-standard-8 Intel Skylake Tesla V100
- n1-standard-16 Intel Skylake 2x Tesla V100
- n1-standard-16 Intel Skylake 4x Tesla V100
- n1-standard-16 Intel Skylake 8x Tesla V100
- n1-standard-16 Intel Skylake Tesla V100
- n1-standard-32 Intel Skylake 2x Tesla V100
- n1-standard-32 Intel Skylake 4x Tesla V100
- n1-standard-32 Intel Skylake 8x Tesla V100
- n1-standard-32 Intel Skylake Tesla V100
- n1-standard-64 Intel Skylake 2x Tesla V100
- n1-standard-64 Intel Skylake 4x Tesla V100
- n1-standard-64 Intel Skylake 8x Tesla V100
- n1-standard-64 Intel Skylake Tesla V100
- n1-standard-96 Intel Skylake 2x Tesla V100
- n1-standard-96 Intel Skylake 4x Tesla V100
- n1-standard-96 Intel Skylake 8x Tesla V100
- n1-standard-96 Intel Skylake Tesla V100