n1-highcpu-8 Intel Skylake by Google Cloud
Geekbench is a cross-platform processor benchmark with a scoring system that determines single-core and multi-core performance using loads simulating real-world scenarios. Geekbench 5 score is calculated with a reference score of 2500 representing the performance of the Intel Core i5-2520M @ 2.50 GHz. The software benchmark is available for Mac OS, Windows, Linux, Android and iOS platforms.
Specifications:
CPU
8
RAM
7.2 GB
{
"configuration": {
"chart": {
"type": "scatter",
"polar": false,
"zoomType": "",
"options3d": {},
"height": null,
"width": null,
"margin": null,
"inverted": false,
"zooming": {}
},
"credits": {
"enabled": false
},
"title": {
"text": ""
},
"colorAxis": null,
"subtitle": {
"text": ""
},
"xAxis": {
"title": {
"text": [
"Single Score"
],
"useHTML": false,
"style": {
"color": "#666666"
}
},
"categories": null,
"lineWidth": 1,
"tickInterval": null,
"tickWidth": 1,
"tickLength": 10,
"tickPixelInterval": 100,
"plotLines": null,
"labels": {
"enabled": true,
"format": null,
"formatter": "",
"style": {
"color": "#666666",
"cursor": "default",
"fontSize": "11px"
},
"useHTML": false,
"step": 0
},
"plotBands": null,
"visible": true,
"floor": null,
"ceiling": null,
"type": "linear",
"min": 0,
"gridLineWidth": 1,
"gridLineColor": "#e6e6e6",
"minorTickInterval": null,
"minorTickWidth": 0,
"minTickInterval": null,
"startOnTick": true,
"endOnTick": true,
"tickmarkPlacement": 100,
"units": 100,
"minRange": 100
},
"yAxis": {
"title": {
"text": [
"Multi Score"
],
"useHTML": false,
"style": {
"color": "#666666"
}
},
"categories": null,
"plotLines": null,
"plotBands": null,
"lineWidth": null,
"tickInterval": null,
"tickLength": 10,
"floor": null,
"ceiling": null,
"gridLineInterpolation": null,
"gridLineWidth": 1,
"gridLineColor": "#e6e6e6",
"min": 0,
"max": null,
"minorTickInterval": null,
"minorTickWidth": 0,
"minTickInterval": null,
"startOnTick": true,
"endOnTick": true,
"minRange": null,
"type": "linear",
"tickmarkPlacement": null,
"labels": {
"enabled": true,
"formatter": null,
"style": {
"color": "#666666",
"cursor": "default",
"fontSize": "11px"
},
"useHTML": false
}
},
"zAxis": {
"title": {
"text": "Multi Score"
}
},
"plotOptions": {
"series": {
"dataLabels": {
"enabled": false,
"format": null,
"distance": 30,
"align": "center",
"inside": null,
"allowOverlap": false,
"style": {
"fontSize": "11px"
}
},
"showInLegend": null,
"turboThreshold": 0,
"stacking": "",
"groupPadding": 0.2,
"centerInCategory": false,
"findNearestPointBy": "x"
}
},
"navigator": {
"enabled": false
},
"scrollbar": {
"enabled": false
},
"rangeSelector": {
"enabled": false,
"inputEnabled": false
},
"legend": {
"enabled": null,
"maxHeight": null,
"align": "center",
"verticalAlign": "bottom",
"layout": "horizontal",
"width": null,
"margin": 12,
"reversed": false
},
"series": [
{
"name": "n1-highcpu-8 Intel Skylake by Google Cloud",
"color": "#55b400",
"data": [
{
"x": 735.8237946787756,
"y": 3482.3259593685984
},
{
"x": 725.1353428089626,
"y": 3455.412360659021
},
{
"x": 737.1976564766471,
"y": 3482.178840066601
},
{
"x": 737.4361813147834,
"y": 3465.7797902808916
},
{
"x": 739.0964315004511,
"y": 3482.515624688296
},
{
"x": 737.9131812591469,
"y": 3463.969863933815
},
{
"x": 736.346626186694,
"y": 3476.156957484714
},
{
"x": 735.0294290081262,
"y": 3460.3036912175958
},
{
"x": 737.1694543923694,
"y": 3478.5277915822226
},
{
"x": 733.0277373289846,
"y": 3457.425840750353
},
{
"x": 741.7831055031622,
"y": 3519.1043178465543
},
{
"x": 733.8691648639572,
"y": 3499.5403956781984
},
{
"x": 744.6899763305479,
"y": 3520.3748426646885
},
{
"x": 737.0132546256048,
"y": 3487.5274390249315
},
{
"x": 741.2962520115796,
"y": 3510.6596549498436
},
{
"x": 735.0066425490297,
"y": 3487.3654028933934
},
{
"x": 742.6756834370588,
"y": 3516.634663198169
},
{
"x": 731.4955706457721,
"y": 3486.6362288432692
},
{
"x": 742.8609388107859,
"y": 3513.036703154202
},
{
"x": 737.9709529997508,
"y": 3492.580919483922
},
{
"x": 743.7020936942797,
"y": 3517.7831552567527
},
{
"x": 734.8606433563016,
"y": 3486.6756046929586
},
{
"x": 743.1935951670876,
"y": 3508.390558767849
},
{
"x": 735.3592030465029,
"y": 3492.7967628767337
},
{
"x": 739.9604745168879,
"y": 3509.632752770682
},
{
"x": 735.0536540184266,
"y": 3488.1855604733473
},
{
"x": 742.5421492327682,
"y": 3505.635471253101
},
{
"x": 736.0449720025907,
"y": 3471.5588404874516
},
{
"x": 742.2021128646098,
"y": 3519.599294531984
},
{
"x": 735.7656316572328,
"y": 3474.7204589688395
}
]
}
],
"drilldown": {},
"tooltip": {
"enabled": true,
"useHTML": false,
"format": null,
"headerFormat": "",
"pointFormat": "<span style=\"color:{series.color}\">Single</span>: <b>{point.x:.0f}</b><br><span style=\"color:{series.color}\">Multi</span>: <b>{point.y:.0f}</b>",
"footerFormat": "",
"shared": false,
"outside": false,
"valueDecimals": null,
"split": false
},
"annotations": null
},
"hc_type": "chart",
"id": "30813201337361886527508998099886691237"
}
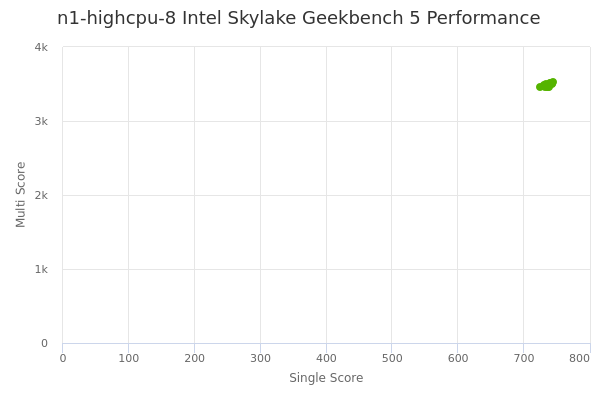
| Single | Multi | |
|---|---|---|
| Max | 745 | 3520 |
| Average | 738 | 3490 |
| Deviation | 4.19 | 19.72 |
| Min | 725 | 3455 |
Sign up as Freemium to get more insight.