e2-standard-2 Intel Skylake by Google Cloud
Geekbench is a cross-platform processor benchmark with a scoring system that determines single-core and multi-core performance using loads simulating real-world scenarios. Geekbench 5 score is calculated with a reference score of 2500 representing the performance of the Intel Core i5-2520M @ 2.50 GHz. The software benchmark is available for Mac OS, Windows, Linux, Android and iOS platforms.
Specifications:
CPU
2
RAM
8.0 GB
{
"configuration": {
"chart": {
"type": "scatter",
"polar": false,
"zoomType": "",
"options3d": {},
"height": null,
"width": null,
"margin": null,
"inverted": false,
"zooming": {}
},
"credits": {
"enabled": false
},
"title": {
"text": ""
},
"colorAxis": null,
"subtitle": {
"text": ""
},
"xAxis": {
"title": {
"text": [
"Single Score"
],
"useHTML": false,
"style": {
"color": "#666666"
}
},
"categories": null,
"lineWidth": 1,
"tickInterval": null,
"tickWidth": 1,
"tickLength": 10,
"tickPixelInterval": 100,
"plotLines": null,
"labels": {
"enabled": true,
"format": null,
"formatter": "",
"style": {
"color": "#666666",
"cursor": "default",
"fontSize": "11px"
},
"useHTML": false,
"step": 0
},
"plotBands": null,
"visible": true,
"floor": null,
"ceiling": null,
"type": "linear",
"min": 0,
"gridLineWidth": 1,
"gridLineColor": "#e6e6e6",
"minorTickInterval": null,
"minorTickWidth": 0,
"minTickInterval": null,
"startOnTick": true,
"endOnTick": true,
"tickmarkPlacement": 100,
"units": 100,
"minRange": 100
},
"yAxis": {
"title": {
"text": [
"Multi Score"
],
"useHTML": false,
"style": {
"color": "#666666"
}
},
"categories": null,
"plotLines": null,
"plotBands": null,
"lineWidth": null,
"tickInterval": null,
"tickLength": 10,
"floor": null,
"ceiling": null,
"gridLineInterpolation": null,
"gridLineWidth": 1,
"gridLineColor": "#e6e6e6",
"min": 0,
"max": null,
"minorTickInterval": null,
"minorTickWidth": 0,
"minTickInterval": null,
"startOnTick": true,
"endOnTick": true,
"minRange": null,
"type": "linear",
"tickmarkPlacement": null,
"labels": {
"enabled": true,
"formatter": null,
"style": {
"color": "#666666",
"cursor": "default",
"fontSize": "11px"
},
"useHTML": false
}
},
"zAxis": {
"title": {
"text": "Multi Score"
}
},
"plotOptions": {
"series": {
"dataLabels": {
"enabled": false,
"format": null,
"distance": 30,
"align": "center",
"inside": null,
"allowOverlap": false,
"style": {
"fontSize": "11px"
}
},
"showInLegend": null,
"turboThreshold": 0,
"stacking": "",
"groupPadding": 0.2,
"centerInCategory": false,
"findNearestPointBy": "x"
}
},
"navigator": {
"enabled": false
},
"scrollbar": {
"enabled": false
},
"rangeSelector": {
"enabled": false,
"inputEnabled": false
},
"legend": {
"enabled": null,
"maxHeight": null,
"align": "center",
"verticalAlign": "bottom",
"layout": "horizontal",
"width": null,
"margin": 12,
"reversed": false
},
"series": [
{
"name": "e2-standard-2 Intel Skylake by Google Cloud",
"color": "#55b400",
"data": [
{
"x": 708.165429277953,
"y": 859.3335530242753
},
{
"x": 697.2641987566765,
"y": 847.8272340199026
},
{
"x": 710.4599676573393,
"y": 861.5944918359871
},
{
"x": 694.7968388296395,
"y": 849.3017181830701
},
{
"x": 713.2195604400797,
"y": 861.2109754155958
},
{
"x": 697.8987013605858,
"y": 848.6225314827918
},
{
"x": 711.9121418158928,
"y": 863.3623086069506
},
{
"x": 694.613996803684,
"y": 846.1422987630849
},
{
"x": 711.3024041285688,
"y": 859.0965902204448
},
{
"x": 695.4583268012625,
"y": 846.89959626939
},
{
"x": 699.4252090832945,
"y": 849.5212303120102
},
{
"x": 699.1914562404935,
"y": 845.1324727711622
},
{
"x": 701.4707061132615,
"y": 852.3547779087959
},
{
"x": 699.8593900012911,
"y": 843.4993456451255
},
{
"x": 697.6861018753563,
"y": 848.9160200667267
},
{
"x": 697.7799948567582,
"y": 851.7519494406231
},
{
"x": 701.0870692753829,
"y": 849.768893162865
},
{
"x": 699.8740450631392,
"y": 852.6939893377493
},
{
"x": 697.5232515957381,
"y": 851.3355063161629
},
{
"x": 694.9161506901189,
"y": 847.381788428011
}
]
}
],
"drilldown": {},
"tooltip": {
"enabled": true,
"useHTML": false,
"format": null,
"headerFormat": "",
"pointFormat": "<span style=\"color:{series.color}\">Single</span>: <b>{point.x:.0f}</b><br><span style=\"color:{series.color}\">Multi</span>: <b>{point.y:.0f}</b>",
"footerFormat": "",
"shared": false,
"outside": false,
"valueDecimals": null,
"split": false
},
"annotations": null
},
"hc_type": "chart",
"id": "209866379003998793863210343701593407743"
}
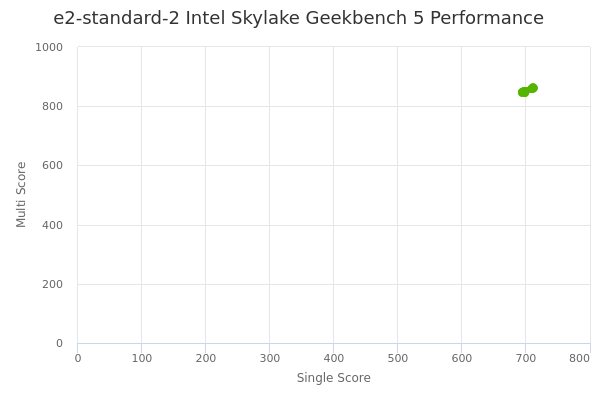
| Single | Multi | |
|---|---|---|
| Max | 713 | 863 |
| Average | 701 | 852 |
| Deviation | 6.03 | 5.78 |
| Min | 695 | 843 |
Sign up as Freemium to get more insight.