c5.3xlarge by Genesis Hosting Solutions
Geekbench is a cross-platform processor benchmark with a scoring system that determines single-core and multi-core performance using loads simulating real-world scenarios. Geekbench 5 score is calculated with a reference score of 2500 representing the performance of the Intel Core i5-2520M @ 2.50 GHz. The software benchmark is available for Mac OS, Windows, Linux, Android and iOS platforms.
Specifications:
CPU
6
RAM
24.0 GB
{
"configuration": {
"chart": {
"type": "scatter",
"polar": false,
"zoomType": "",
"options3d": {},
"height": null,
"width": null,
"margin": null,
"inverted": false,
"zooming": {}
},
"credits": {
"enabled": false
},
"title": {
"text": ""
},
"colorAxis": null,
"subtitle": {
"text": ""
},
"xAxis": {
"title": {
"text": [
"Single Score"
],
"useHTML": false,
"style": {
"color": "#666666"
}
},
"categories": null,
"lineWidth": 1,
"tickInterval": null,
"tickWidth": 1,
"tickLength": 10,
"tickPixelInterval": 100,
"plotLines": null,
"labels": {
"enabled": true,
"format": null,
"formatter": "",
"style": {
"color": "#666666",
"cursor": "default",
"fontSize": "11px"
},
"useHTML": false,
"step": 0
},
"plotBands": null,
"visible": true,
"floor": null,
"ceiling": null,
"type": "linear",
"min": 0,
"gridLineWidth": 1,
"gridLineColor": "#e6e6e6",
"minorTickInterval": null,
"minorTickWidth": 0,
"minTickInterval": null,
"startOnTick": true,
"endOnTick": true,
"tickmarkPlacement": 100,
"units": 100,
"minRange": 100
},
"yAxis": {
"title": {
"text": [
"Multi Score"
],
"useHTML": false,
"style": {
"color": "#666666"
}
},
"categories": null,
"plotLines": null,
"plotBands": null,
"lineWidth": null,
"tickInterval": null,
"tickLength": 10,
"floor": null,
"ceiling": null,
"gridLineInterpolation": null,
"gridLineWidth": 1,
"gridLineColor": "#e6e6e6",
"min": 0,
"max": null,
"minorTickInterval": null,
"minorTickWidth": 0,
"minTickInterval": null,
"startOnTick": true,
"endOnTick": true,
"minRange": null,
"type": "linear",
"tickmarkPlacement": null,
"labels": {
"enabled": true,
"formatter": null,
"style": {
"color": "#666666",
"cursor": "default",
"fontSize": "11px"
},
"useHTML": false
}
},
"zAxis": {
"title": {
"text": "Multi Score"
}
},
"plotOptions": {
"series": {
"dataLabels": {
"enabled": false,
"format": null,
"distance": 30,
"align": "center",
"inside": null,
"allowOverlap": false,
"style": {
"fontSize": "11px"
}
},
"showInLegend": null,
"turboThreshold": 0,
"stacking": "",
"groupPadding": 0.2,
"centerInCategory": false,
"findNearestPointBy": "x"
}
},
"navigator": {
"enabled": false
},
"scrollbar": {
"enabled": false
},
"rangeSelector": {
"enabled": false,
"inputEnabled": false
},
"legend": {
"enabled": null,
"maxHeight": null,
"align": "center",
"verticalAlign": "bottom",
"layout": "horizontal",
"width": null,
"margin": 12,
"reversed": false
},
"series": [
{
"name": "c5.3xlarge by Genesis Hosting Solutions",
"color": "#c16b28",
"data": [
{
"x": 994.8581705682922,
"y": 5679.562590855173
},
{
"x": 995.0005677372292,
"y": 5671.991285746584
},
{
"x": 1007.0825968359128,
"y": 5654.896218854497
},
{
"x": 995.1682917373245,
"y": 5674.803698336451
},
{
"x": 1008.9311365294384,
"y": 5713.157132652582
},
{
"x": 1004.7927406389316,
"y": 5717.206357966484
},
{
"x": 1005.5790380736863,
"y": 5691.142304989598
},
{
"x": 1005.882064506744,
"y": 5672.377631682095
},
{
"x": 1011.160052565243,
"y": 5702.286292019123
},
{
"x": 1014.9767878884729,
"y": 5658.736001118466
},
{
"x": 1030.1739229109987,
"y": 5739.229771673495
},
{
"x": 1001.5637319379791,
"y": 5678.399756567047
},
{
"x": 1033.5231568813472,
"y": 5753.476496204181
},
{
"x": 1007.0531520295065,
"y": 5632.125976311527
},
{
"x": 1001.9842643123159,
"y": 5648.493025765292
},
{
"x": 1030.1374386394903,
"y": 5739.627823794503
},
{
"x": 1008.0021608533741,
"y": 5674.7803479451495
},
{
"x": 1033.5158220607666,
"y": 5739.187747467484
},
{
"x": 1008.634527467378,
"y": 5695.479294280417
},
{
"x": 1034.6459891111258,
"y": 5737.886525006573
}
]
}
],
"drilldown": {},
"tooltip": {
"enabled": true,
"useHTML": false,
"format": null,
"headerFormat": "",
"pointFormat": "<span style=\"color:{series.color}\">Single</span>: <b>{point.x:.0f}</b><br><span style=\"color:{series.color}\">Multi</span>: <b>{point.y:.0f}</b>",
"footerFormat": "",
"shared": false,
"outside": false,
"valueDecimals": null,
"split": false
},
"annotations": null
},
"hc_type": "chart",
"id": "41657647975502453684042785166476115473"
}
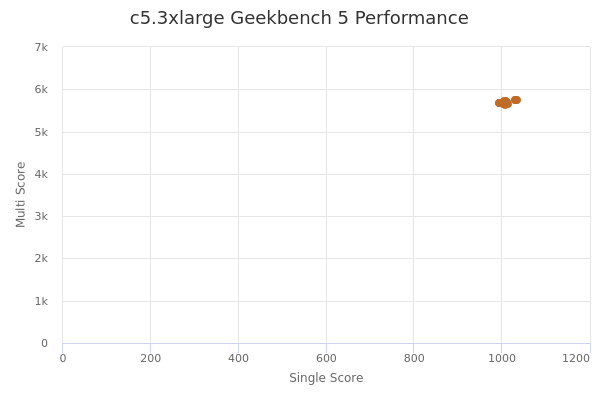
| Single | Multi | |
|---|---|---|
| Max | 1035 | 5753 |
| Average | 1012 | 5694 |
| Deviation | 13.03 | 34.23 |
| Min | 995 | 5632 |
Sign up as Freemium to get more insight.
- In same series
- c5.large
- c5.xlarge
- c5.2xlarge
- c5.3xlarge
- c5.4xlarge
- c5.6xlarge
- c5.8xlarge