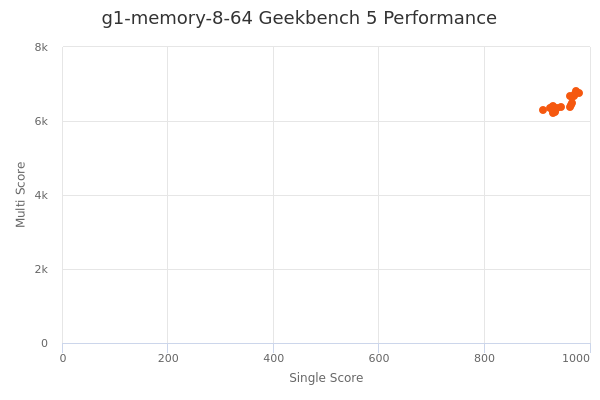
g1-memory-8-64 by G-Core
Geekbench is a cross-platform processor benchmark with a scoring system that determines single-core and multi-core performance using loads simulating real-world scenarios. Geekbench 5 score is calculated with a reference score of 2500 representing the performance of the Intel Core i5-2520M @ 2.50 GHz. The software benchmark is available for Mac OS, Windows, Linux, Android and iOS platforms.
Specifications:
CPU
8
RAM
64.0 GB
{
"configuration": {
"chart": {
"type": "scatter",
"polar": false,
"zoomType": "",
"options3d": {},
"height": null,
"width": null,
"margin": null,
"inverted": false,
"zooming": {}
},
"credits": {
"enabled": false
},
"title": {
"text": ""
},
"colorAxis": null,
"subtitle": {
"text": ""
},
"xAxis": {
"title": {
"text": [
"Single Score"
],
"useHTML": false,
"style": {
"color": "#666666"
}
},
"categories": null,
"lineWidth": 1,
"tickInterval": null,
"tickWidth": 1,
"tickLength": 10,
"tickPixelInterval": 100,
"plotLines": null,
"labels": {
"enabled": true,
"format": null,
"formatter": "",
"style": {
"color": "#666666",
"cursor": "default",
"fontSize": "11px"
},
"useHTML": false,
"step": 0
},
"plotBands": null,
"visible": true,
"floor": null,
"ceiling": null,
"type": "linear",
"min": 0,
"gridLineWidth": 1,
"gridLineColor": "#e6e6e6",
"minorTickInterval": null,
"minorTickWidth": 0,
"minTickInterval": null,
"startOnTick": true,
"endOnTick": true,
"tickmarkPlacement": 100,
"units": 100,
"minRange": 100
},
"yAxis": {
"title": {
"text": [
"Multi Score"
],
"useHTML": false,
"style": {
"color": "#666666"
}
},
"categories": null,
"plotLines": null,
"plotBands": null,
"lineWidth": null,
"tickInterval": null,
"tickLength": 10,
"floor": null,
"ceiling": null,
"gridLineInterpolation": null,
"gridLineWidth": 1,
"gridLineColor": "#e6e6e6",
"min": 0,
"max": null,
"minorTickInterval": null,
"minorTickWidth": 0,
"minTickInterval": null,
"startOnTick": true,
"endOnTick": true,
"minRange": null,
"type": "linear",
"tickmarkPlacement": null,
"labels": {
"enabled": true,
"formatter": null,
"style": {
"color": "#666666",
"cursor": "default",
"fontSize": "11px"
},
"useHTML": false
}
},
"zAxis": {
"title": {
"text": "Multi Score"
}
},
"plotOptions": {
"series": {
"dataLabels": {
"enabled": false,
"format": null,
"distance": 30,
"align": "center",
"inside": null,
"allowOverlap": false,
"style": {
"fontSize": "11px"
}
},
"showInLegend": null,
"turboThreshold": 0,
"stacking": "",
"groupPadding": 0.2,
"centerInCategory": false,
"findNearestPointBy": "x"
}
},
"navigator": {
"enabled": false
},
"scrollbar": {
"enabled": false
},
"rangeSelector": {
"enabled": false,
"inputEnabled": false
},
"legend": {
"enabled": null,
"maxHeight": null,
"align": "center",
"verticalAlign": "bottom",
"layout": "horizontal",
"width": null,
"margin": 12,
"reversed": false
},
"series": [
{
"name": "g1-memory-8-64 by G-Core",
"color": "#F5580F",
"data": [
{
"x": 962.1766318203174,
"y": 6365.488357641356
},
{
"x": 934.8246739065389,
"y": 6279.305057818972
},
{
"x": 963.0179141373552,
"y": 6677.067790508658
},
{
"x": 930.5271662171558,
"y": 6392.462637186711
},
{
"x": 979.5144258360102,
"y": 6756.291394119149
},
{
"x": 931.303656903814,
"y": 6205.1701922242255
},
{
"x": 966.5738610174365,
"y": 6646.165942423913
},
{
"x": 924.8301739581087,
"y": 6360.411723291346
},
{
"x": 973.4448756074901,
"y": 6797.437471088576
},
{
"x": 927.9903095926265,
"y": 6391.5482726396285
},
{
"x": 965.9289176060779,
"y": 6498.7757204321415
},
{
"x": 911.5568917051061,
"y": 6303.120506365185
},
{
"x": 969.6481843703336,
"y": 6665.02262785548
},
{
"x": 934.4173742733523,
"y": 6254.6239610556895
},
{
"x": 965.5922198861105,
"y": 6425.45388394353
},
{
"x": 930.3704791122984,
"y": 6260.829036930791
},
{
"x": 973.0057864057234,
"y": 6724.209396472055
},
{
"x": 938.690132367083,
"y": 6345.816570153558
},
{
"x": 972.2360960581227,
"y": 6730.035642584546
},
{
"x": 945.3303217338891,
"y": 6375.610007431727
}
]
}
],
"drilldown": {},
"tooltip": {
"enabled": true,
"useHTML": false,
"format": null,
"headerFormat": "",
"pointFormat": "<span style=\"color:{series.color}\">Single</span>: <b>{point.x:.0f}</b><br><span style=\"color:{series.color}\">Multi</span>: <b>{point.y:.0f}</b>",
"footerFormat": "",
"shared": false,
"outside": false,
"valueDecimals": null,
"split": false
},
"annotations": null
},
"hc_type": "chart",
"id": "39101297573638400830141488189006502438"
}
| Single | Multi | |
|---|---|---|
| Max | 980 | 6797 |
| Average | 950 | 6473 |
| Deviation | 20.31 | 189.73 |
| Min | 912 | 6205 |
Sign up as Freemium to get more insight.
- In same series
- g1-memory-2-16
- g1-memory-4-32
- g1-memory-8-64
- g1-memory-16-128
- g1-memory-32-256