SO 2VCPU 16GB by DigitalOcean
Geekbench is a cross-platform processor benchmark with a scoring system that determines single-core and multi-core performance using loads simulating real-world scenarios. Geekbench 5 score is calculated with a reference score of 2500 representing the performance of the Intel Core i5-2520M @ 2.50 GHz. The software benchmark is available for Mac OS, Windows, Linux, Android and iOS platforms.
Specifications:
CPU
2
RAM
16.0 GB
Root
300 GB
Root SSD
{
"configuration": {
"chart": {
"type": "scatter",
"polar": false,
"zoomType": "",
"options3d": {},
"height": null,
"width": null,
"margin": null,
"inverted": false,
"zooming": {}
},
"credits": {
"enabled": false
},
"title": {
"text": ""
},
"colorAxis": null,
"subtitle": {
"text": ""
},
"xAxis": {
"title": {
"text": [
"Single Score"
],
"useHTML": false,
"style": {
"color": "#666666"
}
},
"categories": null,
"lineWidth": 1,
"tickInterval": null,
"tickWidth": 1,
"tickLength": 10,
"tickPixelInterval": 100,
"plotLines": null,
"labels": {
"enabled": true,
"format": null,
"formatter": "",
"style": {
"color": "#666666",
"cursor": "default",
"fontSize": "11px"
},
"useHTML": false,
"step": 0
},
"plotBands": null,
"visible": true,
"floor": null,
"ceiling": null,
"type": "linear",
"min": 0,
"gridLineWidth": 1,
"gridLineColor": "#e6e6e6",
"minorTickInterval": null,
"minorTickWidth": 0,
"minTickInterval": null,
"startOnTick": true,
"endOnTick": true,
"tickmarkPlacement": 100,
"units": 100,
"minRange": 100
},
"yAxis": {
"title": {
"text": [
"Multi Score"
],
"useHTML": false,
"style": {
"color": "#666666"
}
},
"categories": null,
"plotLines": null,
"plotBands": null,
"lineWidth": null,
"tickInterval": null,
"tickLength": 10,
"floor": null,
"ceiling": null,
"gridLineInterpolation": null,
"gridLineWidth": 1,
"gridLineColor": "#e6e6e6",
"min": 0,
"max": null,
"minorTickInterval": null,
"minorTickWidth": 0,
"minTickInterval": null,
"startOnTick": true,
"endOnTick": true,
"minRange": null,
"type": "linear",
"tickmarkPlacement": null,
"labels": {
"enabled": true,
"formatter": null,
"style": {
"color": "#666666",
"cursor": "default",
"fontSize": "11px"
},
"useHTML": false
}
},
"zAxis": {
"title": {
"text": "Multi Score"
}
},
"plotOptions": {
"series": {
"dataLabels": {
"enabled": false,
"format": null,
"distance": 30,
"align": "center",
"inside": null,
"allowOverlap": false,
"style": {
"fontSize": "11px"
}
},
"showInLegend": null,
"turboThreshold": 0,
"stacking": "",
"groupPadding": 0.2,
"centerInCategory": false,
"findNearestPointBy": "x"
}
},
"navigator": {
"enabled": false
},
"scrollbar": {
"enabled": false
},
"rangeSelector": {
"enabled": false,
"inputEnabled": false
},
"legend": {
"enabled": null,
"maxHeight": null,
"align": "center",
"verticalAlign": "bottom",
"layout": "horizontal",
"width": null,
"margin": 12,
"reversed": false
},
"series": [
{
"name": "SO 2VCPU 16GB by DigitalOcean",
"color": "#057fff",
"data": [
{
"x": 823.440754154255,
"y": 1631.9615005057526
},
{
"x": 906.8698883486704,
"y": 1121.0474566024877
},
{
"x": 830.2911690553558,
"y": 1640.7662077736984
},
{
"x": 909.1538148675505,
"y": 1115.9174332168425
},
{
"x": 845.8967591546796,
"y": 1656.5551567659222
},
{
"x": 944.9653983333985,
"y": 1162.4947036393137
},
{
"x": 826.27224299854,
"y": 1620.194341198096
},
{
"x": 933.8406776236179,
"y": 1152.530436832345
},
{
"x": 840.8585157643814,
"y": 1651.6457805347122
},
{
"x": 932.0485574784067,
"y": 1145.0687191048548
},
{
"x": 845.9574492855131,
"y": 1614.8350806144376
},
{
"x": 937.3019321367235,
"y": 1126.2395167273412
},
{
"x": 827.4347887217848,
"y": 1633.4747131134015
},
{
"x": 930.2343874711934,
"y": 1143.089801951507
},
{
"x": 832.5288477269469,
"y": 1655.42756940368
},
{
"x": 925.9844346392664,
"y": 1136.352649436183
},
{
"x": 831.5454854838475,
"y": 1660.3003407370425
},
{
"x": 930.1316907547723,
"y": 1141.317678653603
},
{
"x": 841.4204620761261,
"y": 1643.4702431557118
},
{
"x": 929.5581024499377,
"y": 1157.7182229031769
}
]
}
],
"drilldown": {},
"tooltip": {
"enabled": true,
"useHTML": false,
"format": null,
"headerFormat": "",
"pointFormat": "<span style=\"color:{series.color}\">Single</span>: <b>{point.x:.0f}</b><br><span style=\"color:{series.color}\">Multi</span>: <b>{point.y:.0f}</b>",
"footerFormat": "",
"shared": false,
"outside": false,
"valueDecimals": null,
"split": false
},
"annotations": null
},
"hc_type": "chart",
"id": "30584251273577264384154731868165531987"
}
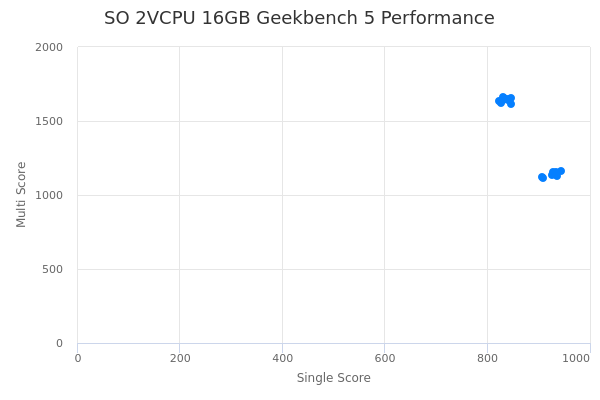
| Single | Multi | |
|---|---|---|
| Max | 945 | 1660 |
| Average | 881 | 1391 |
| Deviation | 47.71 | 250.78 |
| Min | 823 | 1116 |
Sign up as Freemium to get more insight.